
Melilotus indicus (L.) all is a stress-tolerant wild legume widely distributed across the arid and semi-arid regions of Pakistan, yet the genetic basis of its adaptation to harsh environments remains largely uncharacterised. We evaluated genetic diversity, population structure and genotype-environment relationships in ten M. indicus populations sampled from six arid localities (Dera Ismail Khan, Tank, Bhakkar, Layyah, Bahawalpur/Cholistan and Khuzdar) using thirteen polymorphic simple sequence repeat (SSR) markers. In total, 68 alleles were detected, of which 61 (89.7%) were polymorphic, with a mean of 5.23 alleles per locus and an average polymorphic information content (PIC) of 0.63. Mean observed and expected heterozygosity were 0.48 and 0.58, respectively. Bayesian clustering (STRUCTURE), UPGMA and Principal Coordinate Analysis (cumulative variance 56.4%) consistently resolved three genetic clusters that broadly corresponded to geographic origin; 72% of individuals showed strong single-cluster membership and 28% were admixed. Analysis of molecular variance attributed 81% of variation to within populations and 19% among populations (FST = 0.19, P≤ 0.001). Expected heterozygosity correlated positively with annual precipitation (r = 0.68, P = 0.03) and soil organic matter (r = 0.61, P = 0.04) and negatively with electrical conductivity (r = -0.56, P = 0.05), consistent with environmentally structured, adaptive genetic variation. These findings provide the first SSR-based evidence of population-level genetic structuring associated with aridity and soil salinity gradients in Pakistani M. indicus, and identify the Dera Ismail Khan and Tank populations as priority genetic resources for conservation and for breeding drought-tolerant forage legumes.
Research Article · Volume 2, Issue 1, Pages 81–91, 14 November 2026 · Open Access
Genetic Diversity and Population Structure Reveal Signatures of Local Adaptation in Melilotus indicus (L.) All Populations from Arid Regions of Pakistan
, , , , , ,
Affiliations & Notes ⌄
- 1Institute of Biological Sciences, Gomal University, Dera Ismail Khan, 29220, Khyber Pakhtunkhwa, Pakistan
- 2Department of Forestry, The University of Agriculture Dera Ismail Khan, Khyber Pakhtunkhwa, Pakistan
- 3Department of Biotechnology, COMSATS University Islamabad, Abbottabad Campus, Khyber Pakhtunkhwa, Pakistan
- 4Goverment Postgraduate College Dargai, The University of Malakand, Khyber Pakhtunkhwa, Pakistan
- 5Gomal Centre of Biochemistry and Biotechnology, Gomal University, Dera Ismail Khan, 29220, Khyber Pakhtunkhwa, Pakistan
- *Correspondence | Nasr Ullah Khan; Email: nasrkhanpbg@gu.edu.pk
Article Info ⌄
- Journal:
- Journal of Plant Health, Ecology and Evolution
- Submitted Date:
- 24 September 2026
- Accepted Date:
- 16 October 2026
- Published Date:
- 14 November 2026
From the article
- Genetic diversity was consistently highest in the Dera Ismail Khan population (Na= 6.23, He = 0.71, 92.3% polymorphic loci) and lowest in the Khuzdar population (Na= 3.38, He= 0.41, 71.5% polymorphic loci), a roughly two-fold range across the sampled sites.
- Average pairwise genetic similarity among populations was 0.76, with the highest similarity between geographically adjacent pairs (e.g., Dera Ismail Khan-Tank = 0.88; Table 2) and the lowest between geographically distant pairs (e.g., Dera Ismail Khan-Khuzdar = 0.55).
- AMOVA indicated that 81% of total genetic variation occurred within populations and 19% among populations (global FST = 0.19, P≤ 0.001), indicating moderate but statistically significant population differentiation against a background of high within-population diversity.
- This study provides the first SSR-based baseline on the genetic resources of natural Melilotus indicus populations in the arid zone of Pakistan.
Selected from the article's own text.
Abstract
Introduction
The genus Melilotus (Fabaceae) comprises approximately 19 annual and biennial legume species distributed across the temperate and subtropical regions of Europe, Asia, North Africa, and the Mediterranean basin ; . Among these, Melilotus indicus (L.) All., commonly known as Indian sweet clover, is valued as a forage crop, green manure, medicinal plant, and nectar source, and it combines this utility with an exceptional tolerance of drought, heat, and saline soils ; . In Pakistan, M. indicus occurs naturally across Punjab, Khyber Pakhtunkhwa, Sindh, and Balochistan, frequently establishing in drought-prone and saline habitats where summer temperatures exceed 45 °C and rainfall is scarce and erratic .
Arid and semi-arid ecosystems cover roughly one-third of the terrestrial land surface and support approxiamtely two billion people, yet they are increasingly threatened by desertification, land degradation, and declining water availability (UNCCD, 2022; IPCC, 2023). Field surveys in Pakistan’s own arid tracts, including the Cholistan Desert and the plains of southern Punjab, confirm that plant diversity and community composition in these landscapes are already responding measurably to a combination of climatic and anthropogenic pressures ; Maqsood et al., 2024). Pakistan is considered one of the countries most vulnerable to climate change because of its dependence on climate-sensitive agriculture and limited freshwater resources (GoP, 2021), which makes wild, stress-tolerant legumes such as M. indicus useful models for understanding how native plant populations persist under, and adapt to, chronic abiotic stress. Local adaptation, the evolution of heritable traits that enhance adaptation within a population’s native environment, is a principal outcome of natural selection acting on environmentally heterogeneous landscapes ; . Detecting the genomic signatures of this process requires methods that can distinguish adaptive from neutral genetic structure and relate marker variation to measured ecological gradients . Landscape and agricultural genomic approaches that pair molecular data with climatic and edaphic variables have proved particularly informative for identifying such gradients in crop wild relatives and forage species, and are increasingly advocated as a route to more climate-resilient cultivars ; ; .
Simple Sequence Repeat (SSR) markers remain one of the most practical tools for such analyses in non-model, wild plant species because of their co-dominant inheritance, high reproducibility, and sensitivity to fine-scale population differentiation . Molecular studies of Melilotus have so far concentrated on interspecific diversity and marker development: chloroplast and nuclear sequence data have resolved phylogenetic relationships among species , and more recent genomic resources, including miRNA-derived SSRs , a chromosome-scale genome assembly of M. officinalis , and comparative plastome analyses , have substantially expanded the toolkit available for the genus. However, these resources have been applied almost exclusively to germplasm collections outside South Asia, and no study to date has examined adaptive genetic structuring within natural M. indicus populations in Pakistan’s arid regions. Comparable work on other arid-zone legumes underscores the value of this approach. In chickpea landraces sampled along an aridity gradient into the Thal Desert of Punjab, genome-wide SNP variation was measurably structured by elevation and isothermality . Similarly, genotyping-by-sequencing of moth bean (Vigna aconitifolia), a drought-adapted legume of the South Asian drylands, revealed clear population structure linked to geographic origin , while microsatellite-based studies of the medicinal shrub Ephedra across Balochistan’s altitudinal zones have shown that genetic diversity tracks environmental variation even over comparatively short geographic distances . These studies, together with the broader literature on ecological genomics, provide a strong rationale and methodological precedent for examining M. indicus populations from Pakistan’s arid regions.
Despite the ecological and forage value of M. indicus, no comprehensive molecular assessment of its genetic diversity, population structure, or genotype-environment relationships has been undertaken in Pakistan. Addressing this gap is important both for understanding the evolutionary processes that allow the species to persist in extreme environments and for identifying genetically valuable populations for conservation and future breeding of drought- and salinity-tolerant forage legumes. The present study therefore used SSR markers to assess the genetic diversity of M. indicus populations sampled from six arid regions of Pakistan, to characterise their population structure and genetic differentiation, and to evaluate the relationship between genetic variation and key soil and climatic variables as an indicator of local adaptation.
Materials and Methods
Study area and sample collection
Field surveys were conducted during the flowering season (March-May) in the arid and semi-arid tracts of Dera Ismail Khan, Tank, Bhakkar, Layyah, Bahawalpur (Cholistan Desert), and Khuzdar, Pakistan. Ten natural populations were sampled across these localities, and twenty healthy, mature plants were collected from each population while maintaining a minimum inter-plant distance of 10 m to reduce the sampling of closely related individuals, giving a total of 200 samples. Geographic coordinates and elevation were recorded at each site with a handheld GPS receiver (Figure 1; Table 1; Supplementary Figure S6). Plant collection was carried out with permission from the relevant local land authorities and did not involve endangered or legally protected species; no experiments on humans or vertebrate animals were performed.
Species identification and voucher deposition
Representative specimens from each site were pressed, dried, and mounted following standard herbarium procedures , identified using the taxonomic treatment in the Flora of Pakistan , and deposited as authenticated voucher specimens in the Herbarium of the Institute of Biological Sciences, Gomal University, Dera Ismail Khan (Supplementary Figure S1-S3).
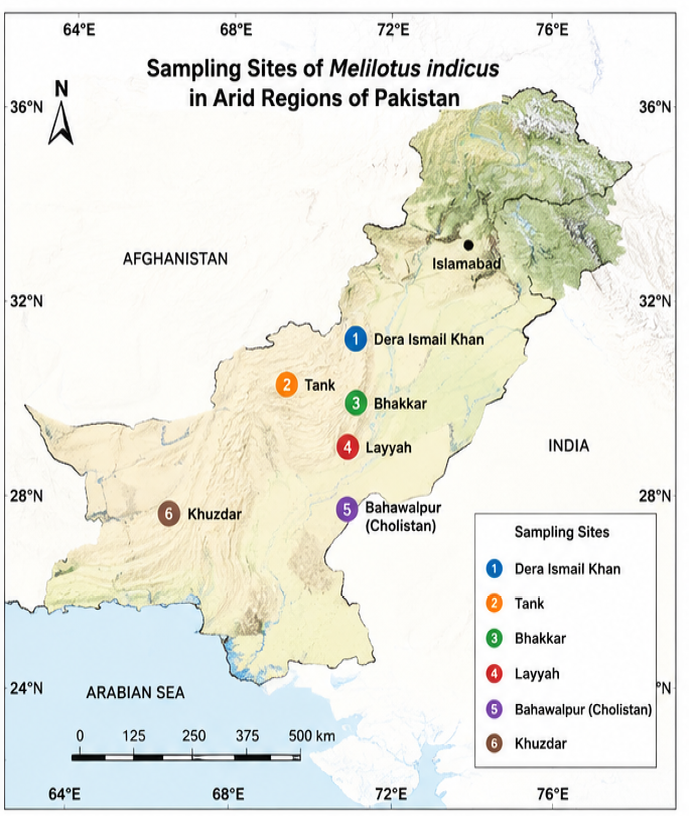
Geographic distribution of the six arid sampling regions of Melilotus indicus populations examined in this study, Pakistan.
Table 1: Geographic coordinates and environmental characteristics of the sampled Melilotus indicus populations, including elevation, annual rainfall, mean annual temperature, soil pH, electrical conductivity, and soil texture.
| Population code | sampling site | Latitude (N) | Longitude (E) | Elevation (m a.s.l.) | Annual rainfall (mm) | Mean annual tem. (°C) | Soil pH (1:2.5) | Soil EC (dS m⁻¹) | Soil texture |
| P1 | Dera Ismail Khan (Site 1) | 31°49' | 70°54' | 165 | 264 | 26.4 | 7.8 | 0.78 | Sandy loam |
| P2 | Dera Ismail Khan (Site 2) | 31°55' | 70°48' | 180 | 251 | 26.7 | 7.9 | 0.82 | Loam |
| P3 | Tank (Site 1) | 32°15' | 70°05' | 210 | 242 | 25.9 | 7.6 | 0.69 | Sandy loam |
| P4 | Tank (Site 2) | 32°10' | 70°12' | 195 | 238 | 26.0 | 7.7 | 0.71 | Loam |
| P5 | Bhakkar (Site 1) | 31°37' | 71°03' | 130 | 196 | 28.3 | 8.1 | 1.12 | Sandy clay loam |
| P6 | Bhakkar (Site 2) | 31°42' | 71°10' | 142 | 189 | 28.6 | 8.0 | 1.08 | Loamy sand |
| P7 | Layyah (Site 1) | 30°57' | 70°57' | 122 | 178 | 29.1 | 8.2 | 1.25 | Sandy loam |
| P8 | Layyah (Site 2) | 31°03' | 70°49' | 115 | 172 | 29.4 | 8.3 | 1.31 | Loamy sand |
| P9 | Bahawalpur (Cholistan) | 29°23' | 71°42' | 102 | 92 | 31.6 | 8.5 | 2.61 | Sand |
| P10 | Khuzdar | 27°48' | 66°36' | 720 | 315 | 24.8 | 7.3 | 0.48 | Sandy loam |

Variation in annual rainfall, mean annual temperature, soil pH, electrical conductivity, and organic matter across the sampled M. indicus populations (S1-S8, representative sites).
Environmental and soil data collection
Climatic variables (annual precipitation, mean annual temperature) were compiled for each site , and topsoil (0-30 cm) was sampled from the rooting zone of each population and analysed for pH, electrical conductivity (EC), organic matter, and texture using standard laboratory procedures (Table 1; Supplementary Figure S4).
DNA extraction and SSR-PCR amplification
Genomic DNA was extracted from silica-dried leaf tissue using the cetyltrimethylammonium bromide (CTAB) method and checked for quality and concentration by agarose gel electrophoresis and spectrophotometry (Supplementary Figure S5). Fifteen SSR primer pairs were screened; thirteen produced clear, reproducible amplification and were retained for genotyping (Supplementary Table S1 summarises primer performance and Supplementary Table S2 gives the PCR cycling conditions). Amplicons were resolved on agarose gels, visualised under UV illumination, and scored for the presence or absence of alleles (Supplementary Figure S7 and S8).
Data analysis
Standard genetic diversity indices (number of alleles per locus, observed and expected heterozygosity, percentage of polymorphic loci, polymorphic information content) were calculated in GenAlEx 6.5 and POPGENE. Genetic relationships among populations were assessed by UPGMA cluster analysis and Principal Coordinate Analysis (PCoA) in GenAlEx/MEGA 11 ; . Bayesian population structure was inferred in STRUCTURE v.2.3.4 using the admixture model, testing K = 1-6 ; the appropriate K was identified from likelihood plateauing and cluster stability . Analysis of Molecular Variance (AMOVA) was used to partition genetic variance within and among populations, and pairwise FST was estimated ; . Pearson correlations were computed between population-level expected heterozygosity and the corresponding environmental and soil variables. All statistical tests used α = 0.05.
Results
Sampling sites and environmental variation
The ten populations spanned considerable environmental heterogeneity: annual rainfall ranged from 92 to 315 mm, mean annual temperature from 24.8 to 31.6 °C, soil pH from 7.3 to 8.5, electrical conductivity from 0.48 to 2.61 dS m⁻¹, and organic matter from 0.32 to 1.08% (Table 1; Figure 2; Supplementary Table S3). Populations from Bahawalpur (Cholistan) experienced the lowest rainfall and highest salinity, whereas Dera Ismail Khan and Khuzdar populations occupied comparatively less saline, higher-rainfall sites.
SSR polymorphism
Of fifteen SSR primer pairs screened, thirteen amplified consistently and were used for genotyping. Fragment sizes ranged from 110 to 320 bp. Across all loci, 68 alleles were detected, of which 61 (89.7%) were polymorphic (Figure 3A), with between 3 and 9 alleles per locus (mean= 5.23; Figure 3B).
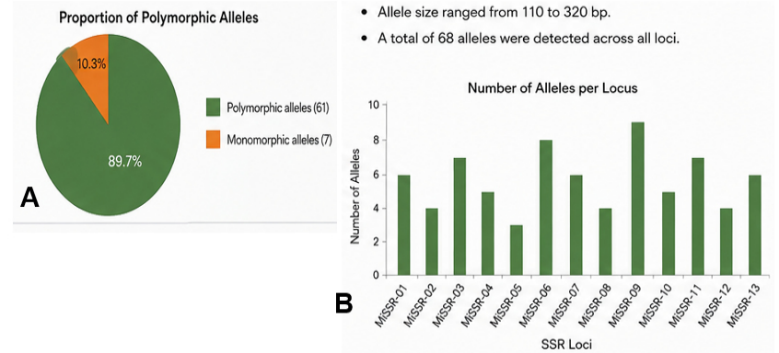
SSR marker polymorphism in Melilotus indicus. (A) Proportion of polymorphic vs monomorphic alleles across 13 loci. (B) Number of alleles detected per SSR locus (MiSSR-01 to MiSSR-13).
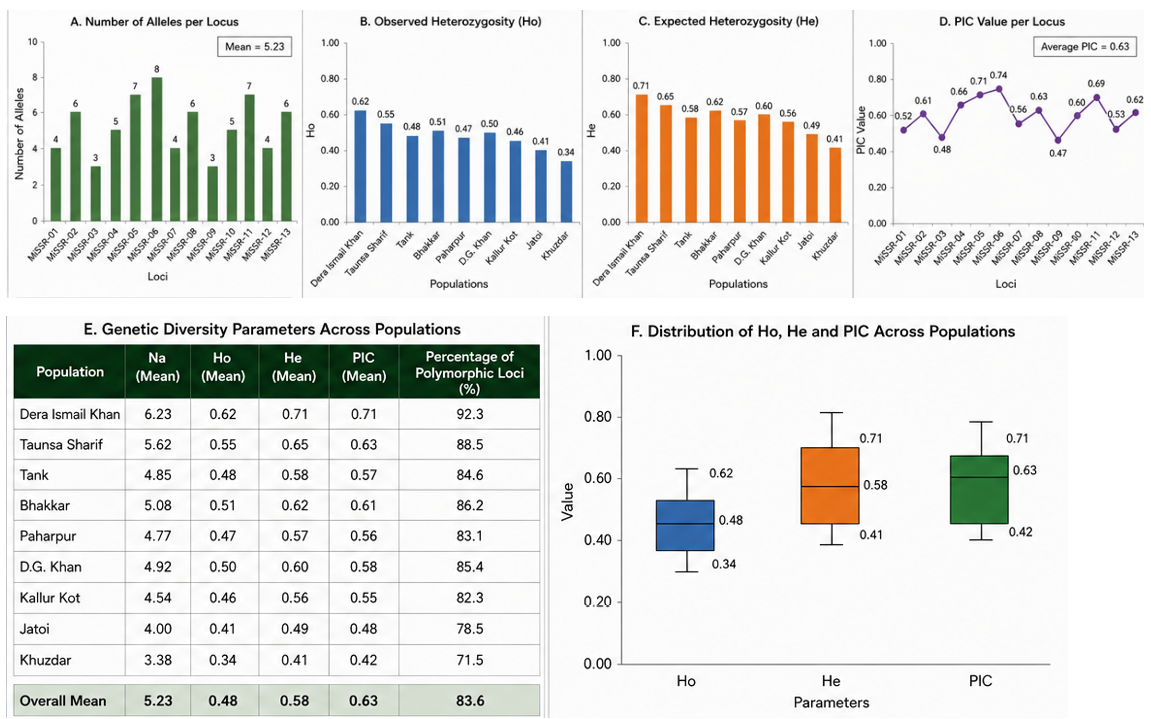
Genetic diversity of Melilotus indicus populations based on SSR markers. (a) Number of alleles per locus, observed heterozygosity (Ho), expected heterozygosity (He), and polymorphic information content (PIC) per locus. (b) Population-wise diversity parameters (mean number of alleles, Ho, He, PIC, and percentage of polymorphic loci) and their distribution across populations.
Genetic diversity within populations
Observed heterozygosity (Ho) ranged from 0.34 to 0.62 (mean= 0.48) and expected heterozygosity (He) from 0.41 to 0.71 (mean= 0.58) across populations; mean PIC was 0.63, confirming that the retained loci were highly informative (Figure 4). Genetic diversity was consistently highest in the Dera Ismail Khan population (Na= 6.23, He = 0.71, 92.3% polymorphic loci) and lowest in the Khuzdar population (Na= 3.38, He= 0.41, 71.5% polymorphic loci), a roughly two-fold range across the sampled sites.
Population relationships and structure
UPGMA clustering based on pairwise genetic similarity grouped the ten populations into three clusters that broadly reflected geographic proximity: a cluster comprising Dera Ismail Khan, Tank, and Paharpur; a second comprising Bhakkar and Layyah; and a third, more heterogeneous cluster comprising Bahawalpur, Rahim Yar Khan, D.G. Khan, Jatoi, and Khuzdar (Figure 5). Average pairwise genetic similarity among populations was 0.76, with the highest similarity between geographically adjacent pairs (e.g., Dera Ismail Khan-Tank = 0.88; Table 2) and the lowest between geographically distant pairs (e.g., Dera Ismail Khan-Khuzdar = 0.55).
Bayesian clustering in STRUCTURE identified K= 3 as the most probable number of genetic clusters, consistent with the UPGMA topology. Approximately 72% of individuals showed strong membership (>0.75 ancestry coefficient) in a single cluster, while the remaining 28% displayed admixed ancestry, particularly among geographically intermediate populations (Figure 6). Genetic differentiation among population pairs (pairwise FST) ranged from near zero between adjacent populations to 0.27 between the most distant pairs.
Principal Coordinate Analysis corroborated the clustering and STRUCTURE results: PCoA1 and PCoA2 explained 34.8% and 21.6% of total genetic variance, respectively (56.4% cumulative). Dera Ismail Khan and Tank individuals clustered tightly together, Bahawalpur and Khuzdar formed distinct, well-separated groups, and Bhakkar and Layyah occupied an intermediate position consistent with partial genetic overlap between the northern and southern populations (Figure 7).
Table 2: Pairwise genetic similarity matrix among Melilotus indicus populations based on SSR marker data.
| Population | 1 | 2 | 4 | 5 | 6 | 7 | 8 | 9 | 10 |
| Dera Ismail Khan | — | 0.88 | 0.82 | 0.74 | 0.73 | 0.66 | 0.58 | 0.57 | 0.55 |
| Tank | 0.88 | — | 0.81 | 0.75 | 0.72 | 0.65 | 0.60 | 0.57 | 0.54 |
| Paharpur | 0.82 | 0.81 | — | 0.72 | 0.70 | 0.64 | 0.59 | 0.55 | 0.53 |
| Bhakkar | 0.74 | 0.75 | 0.72 | — | 0.86 | 0.71 | 0.63 | 0.58 | 0.56 |
| Layyah | 0.73 | 0.72 | 0.70 | 0.86 | — | 0.70 | 0.62 | 0.57 | 0.55 |
| Bahawalpur | 0.66 | 0.65 | 0.64 | 0.71 | 0.70 | — | 0.77 | 0.70 | 0.60 |
| Rahim Yar Khan | 0.61 | 0.60 | 0.59 | 0.63 | 0.62 | 0.77 | — | 0.78 | 0.62 |
| D.G. Khan | 0.58 | 0.57 | 0.56 | 0.59 | 0.58 | 0.70 | 0.78 | — | 0.64 |
| Jatoi | 0.57 | 0.56 | 0.55 | 0.58 | 0.57 | 0.66 | 0.72 | 0.75 | 0.68 |
| Khuzdar | 0.55 | 0.54 | 0.53 | 0.56 | 0.55 | 0.60 | 0.64 | 0.68 | — |
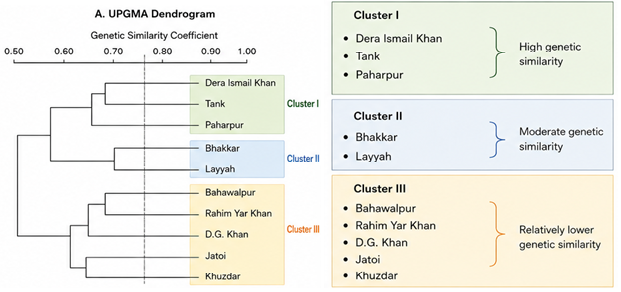
UPGMA dendrogram illustrating genetic relationships among Melilotus indicus populations based on SSR marker data, resolving three major clusters that broadly track geographic origin.
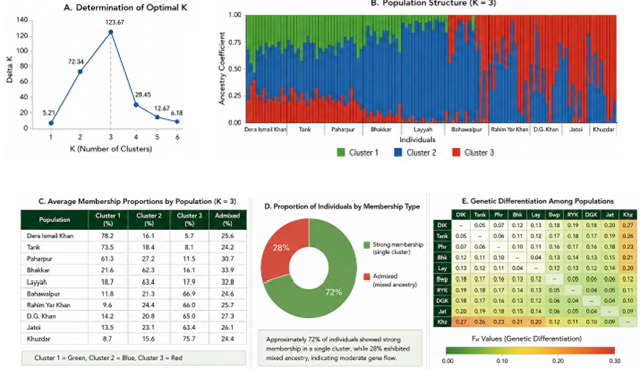
Bayesian population structure analysis (STRUCTURE, K = 3) of Melilotus indicus populations based on SSR data, showing (A) determination of the optimal K, (B) individual ancestry coefficients, (C) mean cluster membership by population, (D) proportion of individuals with strong single-cluster membership versus admixed ancestry, and (E) pairwise genetic differentiation (FST) among populations.
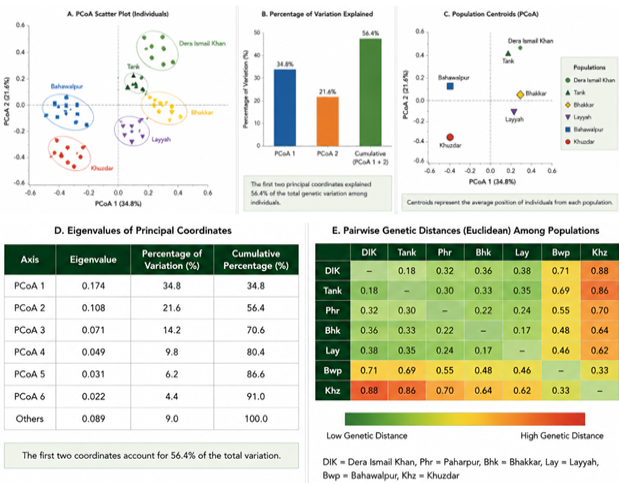
Principal Coordinate Analysis (PCoA) of Melilotus indicus populations based on SSR marker data: (A) individual scatter plot with population ellipses, (B) percentage of genetic variance explained by each coordinate, (C) population centroids, (D) eigenvalues of principal coordinates, and (E) pairwise Euclidean genetic distances among populations.
Partitioning of genetic variation and genotype-environment relationships
AMOVA indicated that 81% of total genetic variation occurred within populations and 19% among populations (global FST = 0.19, P≤ 0.001), indicating moderate but statistically significant population differentiation against a background of high within-population diversity. Expected heterozygosity was positively correlated with annual precipitation (r = 0.68, P = 0.03) and soil organic matter (r = 0.61, P = 0.04), and negatively correlated with soil electrical conductivity (r = -0.56, P = 0.05). A negative association with mean annual temperature approached, but did not reach, statistical significance (r = -0.49, P = 0.08), and is reported here as a trend rather than a confirmed effect.
Discussion
Genetic diversity in relation to other Melilotus studies
This study provides the first SSR-based assessment of genetic diversity and population structure in natural Melilotus indicus populations from the arid regions of Pakistan, and the results are consistent with a pattern of environmentally structured, adaptive genetic variation rather than purely neutral differentiation. The overall level of polymorphism detected (89.7% of alleles polymorphic; mean PIC = 0.63) falls within the range reported for SSR studies of the genus Melilotus elsewhere: EST-SSR and genome-derived markers in Chinese Melilotus germplasm have reported average PIC values between 0.49 and 0.87, depending on marker type and the taxonomic breadth of the accessions screened ; ; . That our substantially narrower, intraspecific sampling of M. indicus from a single country nonetheless yielded comparably informative markers suggests that the species retains considerable standing genetic variation even at the population level, which is a prerequisite for continued adaptive response to the aridity and salinity gradients that characterise its Pakistani range ; .
Population structure and gene flow
The clear separation of populations into three genetic clusters by UPGMA, STRUCTURE, and PCoA, and the fact that this partitioning broadly tracked geographic origin rather than random noise, indicates that gene flow among the sampled populations is restricted enough to permit differentiation, while the substantial admixture detected in 28% of individuals shows that this restriction is incomplete. This combination, high within-population diversity (81% of AMOVA variance) together with a modest but significant among-population component (FST = 0.19), is the pattern expected under an isolation-by-environment or isolation-by-distance model in which local selection and limited dispersal act jointly on standing variation ; ; . A similar decoupling of within- versus among-population variance has been documented in chickpea landraces sampled across an aridity gradient into Pakistan’s Thal Desert, where genome-wide SNP structure was only partially explained by geography and was more strongly linked to elevation and isothermality , and in moth bean populations from the South Asian drylands, where SSR/SNP-based clustering likewise resolved population groups that only partly mirrored simple geographic distance . Read together with the present results, these studies suggest that dryland legumes across South Asia share a common evolutionary signature: substantial within-population variability buffered against episodic drought, overlaid by weaker but detectable structure associated with local environmental gradients.
Genotype-environment relationships
The genotype-environment correlations detected here strengthen this interpretation. Expected heterozygosity increased with annual precipitation and soil organic matter and decreased with soil electrical conductivity, a pattern consistent with reduced effective population size and stronger selective filtering in the driest, most saline sites (notably Bahawalpur/Cholistan) relative to comparatively mesic sites such as Dera Ismail Khan. The negative association with mean annual temperature did not reach conventional statistical significance (P= 0.08) and should be treated as a trend requiring confirmation with a larger population sample rather than as firm evidence of thermal selection. Programmes that pair molecular diversity data with fine-scale climatic and edaphic layers, an approach now formalised as agricultural landscape genomics, have shown that such genotype-environment associations can reliably flag loci and populations of adaptive value in crop wild relatives , and the correlations reported here provide a preliminary, population-level analogue of that approach for M. indicus.
Implications for conservation and breeding
The consistently higher diversity of the Dera Ismail Khan and Tank populations, and the comparatively depauperate Khuzdar population, mirrors a broader pattern in which peripheral or more environmentally extreme populations carry reduced genetic diversity relative to more climatically buffered, central populations ; Hamrick and Godt, 1996). Because adaptive genetic diversity underpins a population’s capacity to respond to future environmental change ; , the Dera Ismail Khan and Tank populations identified here as the most diverse are reasonable priorities for in situ conservation and as source material for breeding programmes targeting drought- and salinity-tolerant forage legumes, in line with recommendations for prioritising evolutionarily significant, high-diversity populations in conservation genomics generally .
Possible physiological basis and future directions
Mechanistically, the physiological basis for the differentiation observed here is likely to involve the well-characterised drought- and salinity-response pathways described in other legumes and dicots, including ABA-mediated stomatal regulation and DREB/NAC/WRKY/MYB transcriptional networks that coordinate osmotic adjustment and antioxidant defence ; . The SSR markers used in the present study are anonymous and were not selected within candidate stress-response genes, so they cannot themselves identify the loci under selection; however, the genome and transcriptome resources now available for related Melilotus species ; ; make targeted genotyping of such candidate regions a feasible next step for this system. Combined with the nitrogen-fixing capacity that already makes M. indicus valuable for soil restoration on marginal land ; , such adaptive variation would be of direct interest to genomics-assisted breeding pipelines for climate-resilient legumes .
Conclusions
This study provides the first SSR-based baseline on the genetic resources of natural Melilotus indicus populations in the arid zone of Pakistan. The species retains substantial standing variation, held largely within populations, overlaid by a moderate but significant structure that follows geography and environment and offers preliminary molecular support for local adaptation along aridity and salinity gradients. These findings are relevant to the in situ conservation of dryland legume diversity and identify the Dera Ismail Khan and Tank populations as candidate source material for breeding drought- and salinity-tolerant forage cultivars, although the small number of populations and the use of anonymous markers mean that the adaptive interpretation remains provisional. Genome-wide markers, common-garden or reciprocal-transplant experiments and a larger, consistently coded set of populations are needed to confirm the adaptive significance of the patterns identified here.
Acknowledgments
The authors thank the Institute of Biological Sciences, Gomal University, Dera Ismail Khan, for laboratory and herbarium facilities. This research received no external funding.
Novelty Statement
This study provide the SSR-based genetic assessment of natural Melilotus indicus populations in the arid zone of Pakistan, revealing substantial within-population genetic variation, geographically and environmentally associated population structure, and preliminary evidence of local adaptation to aridity and salinity, while identifying Dera Ismail Khan and Tank populations as potential genetic resources for developing drought and salinity tolerant forage cultivars.
Author’s Contribution
HS: Field sampling, laboratory analysis, formal analysis, writing original draft. NU: Supervision, conceptualization, writing review and editing. SA, MAK, AS and MK: Data collection and data analysis. NUK: conceptualization, methodology review, writing review and editing. All authors read and approved the final manuscript.
Supplementary material
There is supplementary material associated with this article. Access the material online at:
Generative AI and AI assisted technology statement
The authors declare that no generative AI and AI assisted technology was used in the creation of this manuscript.
Conflict of interest
The authors have declared no conflict of interest.
References
- Ahmed M, Naz N, Abdullah M, Ahmed MM, Maqsood MF, Zulfiqar U, Ahmad K, Alwahibi MS, Elshikh MS (2024). Evaluation of Climatic and Anthropogenic Impacts on Phytosociological Aspects and Conservation Status of Native Flora in One of Protected and Unprotected Habitats of Cholistan Desert, Pakistan. Pol. J. Environ. Stud., 33: 35673586. https://doi.org/10.15244/pjoes/178451 [CrossRef]
- Ali, S.I. and Qaiser, M., 2007. Flora of Pakistan. Department of Botany, University of Karachi, Karachi, Pakistan.
- Basit, A., Saeed, S., Ahmed, A., Baloch, N. and Ali, A.Z., 2021. Genetic structuring of Ephedra, an important medicinal plant, from low to high altitudinal zones of Balochistan, Pakistan. Biodiversitas, 22(2): 713-718. https://doi.org/10.13057/biodiv/d220223 [CrossRef]
- Basu, S., Ramegowda, V., Kumar, A. and Pereira, A., 2016. Plant adaptation to drought stress. F1000Research, 5: 1554. https://doi.org/10.12688/f1000research.7678.1 [CrossRef]
- Bridson, D. and Forman, L., 1998. The herbarium handbook: 3rd ed. Royal Botanic Gardens, Kew, London, UK.
- Campbell, Q., Bedford, J.A., Yu, Y., Halpin-McCormick, A., Castañeda-Álvarez, N., Runck, B., Neyhart, J., Ewing, P., Ortiz-Barrientos, D., Gao, L., Wang, D., Chapman, M.A., Rieseberg, L.H. and Kantar, M.B., 2025. Agricultural landscape genomics to increase crop resilience. Plant Commun., 6: 101260. https://doi.org/10.1016/j.xplc.2025.101260 [CrossRef]
- Cutler, S.R., Rodriguez, P.L., Finkelstein, R.R. and Abrams, S.R., 2010. Abscisic acid: Emergence of a core signaling network. Ann. Rev. Pl. Biol., 61: 651-679. https://doi.org/10.1146/annurev-arplant-042809-112122 [CrossRef]
- Di, H., Duan, Z., Luo, K., Zhang, D., Wu, F., Zhang, J., Liu, W. and Wang, Y., 2015. Interspecific phylogenic relationships within genus Melilotus based on nuclear and chloroplast DNA. PLoS One, 10(7): e0132596. https://doi.org/10.1371/journal.pone.0132596 [CrossRef]
- DiTomaso, J.M. and Healy, E.A., 2007. Weeds of California and other western states, Volume 2. University of California Agriculture and Natural Resources, Oakland, USA.
- Doyle, J.J. and Doyle, J.L., 1990. Isolation of plant DNA from fresh tissue. Focus, 12(1): 13-15.
- Duke, J.A., 1981. Handbook of legumes of world economic importance. Plenum Press, New York, USA. https://doi.org/10.1007/978-1-4684-8151-8 [CrossRef]
- Ejaz, A., Ahmad, K., Khan, Z.I., Mehmood, N., Ashfaq, A., Shad, H.A., Batool, A.I., Memona, H., Sameen, A., Bibi, H.F., Ali, M.A. and Elshikh, M.S., 2024. Evaluation of indigenous plant diversity of Kalabagh, District Mianwali, Pakistan. Pak. J. Bot., 56(4): 1431-1440. https://doi.org/10.30848/PJB2024-4(6) [CrossRef]
- Ellstrand, N.C. and Elam, D.R., 1993. Population genetic consequences of small population size: Implications for plant conservation. Ann. Rev. Ecol. Syst., 24: 217-242. https://doi.org/10.1146/annurev.es.24.110193.001245 [CrossRef]
- Evanno, G., Regnaut, S. and Goudet, J., 2005. Detecting the number of clusters of individuals using the software structure: A simulation study. Mol. Ecol., 14(8): 2611-2620. https://doi.org/10.1111/j.1365-294X.2005.02553.x [CrossRef]
- Excoffier, L., Smouse, P.E. and Quattro, J.M., 1992. Analysis of molecular variance inferred from metric distances among DNA haplotypes. Genetics, 131(2): 479-491. https://doi.org/10.1093/genetics/131.2.479 [CrossRef]
- Fick, S.E. and Hijmans, R.J., 2017. WorldClim 2: New 1-km spatial resolution climate surfaces for global land areas. Int. J. Climatol., 37(12): 4302-4315. https://doi.org/10.1002/joc.5086 [CrossRef]
- Forester, B.R., Lasky, J.R., Wagner, H.H. and Urban, D.L., 2018. Comparing methods for detecting multilocus adaptation with multivariate genotype-environment associations. Mol. Ecol., 27(9): 2215-2233. https://doi.org/10.1111/mec.14584 [CrossRef]
- Frankham, R., Ballou, J.D. and Briscoe, D.A., 2010. Introduction to conservation genetics: 2nd edn. Cambridge University Press, Cambridge, UK. https://doi.org/10.1017/CBO9780511809002 [CrossRef]
- Government of Pakistan, 2021. National climate change policy 2021. Ministry of Climate Change, Islamabad, Pakistan.
- Graham, P.H. and Vance, C.P., 2003. Legumes: Importance and constraints to greater use. Plant Physiol., 131(3): 872-877. https://doi.org/10.1104/pp.017004 [CrossRef]
- Hamrick, J.L. and Godt, M.J.W., 1996. Effects of life history traits on genetic diversity in plant species. Philos. Trans. R. Soc. Lond. B, 351(1345): 1291-1298. https://doi.org/10.1098/rstb.1996.0112 [CrossRef]
- He, Q., Li, Z., Liu, Y., Yang, H., Liu, L., Ren, Y., Zheng, J., Xu, R., Wang, S. and Zhan, Q., 2023. Chromosome-scale assembly and analysis of the Melilotus officinalis genome for SSR development and nodulation gene analysis. Plant Genome, 16: e20345. https://doi.org/10.1002/tpg2.20345 [CrossRef]
- Herridge, D.F., Peoples, M.B. and Boddey, R.M., 2008. Global inputs of biological nitrogen fixation in agricultural systems. Plant Soil, 311(1-2): 1-18. https://doi.org/10.1007/s11104-008-9668-3 [CrossRef]
- Hoban, S., Bruford, M., D’Urban Jackson, J., Lopes-Fernandes, M., Heuertz, M., Hohenlohe, P.A., Paz-Viñas, I., Sjögren-Gulve, P., Segelbacher, G., Vernesi, C., Aitken, S., Bertola, L.D., Bloomer, P., Breed, M., Rodríguez-Correa, H., Funk, W.C., Grueber, C.E., Hunter, M.E., Jaffé, R., Liggins, L., Mergeay, J., Moharrek, F., O’Brien, D., Ogden, R., Palma-Silva, C., Pierson, J., Ramakrishnan, U., Simo-Droissart, M., Tani, N., Waits, L. and Laikre, L., 2020. Genetic diversity targets and indicators in the CBD post-2020 global biodiversity framework must be improved. Biol. Conserv., 248: 108654. https://doi.org/10.1016/j.biocon.2020.108654. [CrossRef]
- Hoban, S., Kelley, J.L., Lotterhos, K.E., Antolin, M.F., Bradburd, G., Lowry, D.B., Poss, M.L., Reed, L.K., Storfer, A. and Whitlock, M.C., 2016. Finding the genomic basis of local adaptation: pitfalls, practical solutions, and future directions. Am. Natur., 188(4): 379-397. https://doi.org/10.1086/688018 [CrossRef]
- Intergovernmental Panel on Climate Change (IPCC), 2023. Climate change 2023: Synthesis report. Contribution of Working Groups I, II and III to the Sixth Assessment Report of the Intergovernmental Panel on Climate Change. IPCC, Geneva, Switzerland.
- Kanzana, G., Musaza, J., Wu, F., Ouyang, Z., Wang, Y., Ma, T., Akoy, B.I.R. and Zhang, J., 2021. Genome-wide development and application of miRNA-SSR markers in Melilotus genus. Physiol. Mol. Biol. Plants, 27(10): 2269-2282. https://doi.org/10.1007/s12298-021-01086-z [CrossRef]
- Kawecki, T.J. and Ebert, D., 2004. Conceptual issues in local adaptation. Ecol. Lett., 7(12): 1225-1241. https://doi.org/10.1111/j.1461-0248.2004.00684.x [CrossRef]
- Kumar, S., Stecher, G. and Tamura, K., 2018. MEGA X: Molecular evolutionary genetics analysis across computing platforms. Mol. Biol. Evol., 35(6): 1547-1549. https://doi.org/10.1093/molbev/msy096 [CrossRef]
- Nakashima, K., Yamaguchi-Shinozaki, K. and Shinozaki, K., 2014. The transcriptional regulatory network in the drought response and its crosstalk in abiotic stress responses involving ABA and DREB1/CBF signaling. Front. Plant Sci., 5: 170. https://doi.org/10.3389/fpls.2014.00170 [CrossRef]
- Nei, M., 1973. Analysis of gene diversity in subdivided populations. Proc. Natl. Acad. Sci. USA, 70(12): 3321-3323. https://doi.org/10.1073/pnas.70.12.3321 [CrossRef]
- Peakall, R. and Smouse, P.E., 2012. GenAlEx 6.5: Genetic analysis in Excel. Population genetic software for teaching and research-an update. Bioinformatics, 28(19): 2537-2539. https://doi.org/10.1093/bioinformatics/bts460 [CrossRef]
- Pritchard, J.K., Stephens, M. and Donnelly, P., 2000. Inference of population structure using multilocus genotype data. Genetics, 155(2): 945-959. https://doi.org/10.1093/genetics/155.2.945 [CrossRef]
- Sani, S.G.A.S., Chang, P.L., Zubair, A., Carrasquilla-Garcia, N., Cordeiro, M., Penmetsa, R.V., Munis, M.F.H., Nuzhdin, S.V., Cook, D.R. and von Wettberg, E.J., 2018. Genetic diversity, population structure, and genetic correlation with climatic variation in chickpea (Cicer arietinum) landraces from Pakistan. Plant Genome, 11: 170067. https://doi.org/10.3835/plantgenome2017.08.0067 [CrossRef]
- Savolainen, O., Lascoux, M. and Merilä, J., 2013. Ecological genomics of local adaptation. Nat. Rev. Genet., 14(11): 807-820. https://doi.org/10.1038/nrg3522 [CrossRef]
- Semagn, K., Bjørnstad, Å. and Ndjiondjop, M.N., 2006. An overview of molecular marker methods for plants. Afr. J. Biotechnol., 5(25): 2540-2568.
- Tigano, A. and Friesen, V.L., 2016. Genomics of local adaptation with gene flow. Mol. Ecol., 25(10): 2144-2164. https://doi.org/10.1111/mec.13606 [CrossRef]
- United Nations Convention to Combat Desertification (UNCCD), 2022. Global land outlook: 2nd edn. UNCCD, Bonn, Germany. [CrossRef]
- Varshney, R.K., Bohra, A., Yu, J., Graner, A., Zhang, Q. and Sorrells, M.E., 2021. Designing future crops: Genomics-assisted breeding comes of age. Trends Plant Sci., 26(6): 631-649. https://doi.org/10.1016/j.tplants.2021.03.010 [CrossRef]
- Weir, B.S. and Cockerham, C.C., 1984. Estimating F-statistics for the analysis of population structure. Evolution, 38(6): 1358-1370. https://doi.org/10.1111/j.1558-5646.1984.tb05657.x [CrossRef]
- Wu, F., Zhang, D., Ma, J., Luo, K., Di, H., Liu, Z., Zhang, J. and Wang, Y., 2016. Analysis of genetic diversity and population structure in accessions of the genus Melilotus. Industrial Crops Prod., 85: 138-145. https://doi.org/10.1016/j.indcrop.2016.02.055 [CrossRef]
- Xu, P., Meng, M., Wu, F. and Zhang, J., 2024. A comparative plastome approach enhances the assessment of genetic variation in the Melilotus genus. BMC Genom., 25: 556. https://doi.org/10.1186/s12864-024-10476-y [CrossRef]
- Yadav, A.K., Singh, C.K., Kalia, R.K., Mittal, S., Wankhede, D.P., Kakani, R.K., Ujjainwal, S., Saroha, A., Nathawat, N.S., Rani, R., Panchariya, P., Choudhary, M., Solanki, K., Chaturvedi, K.K., Archak, S., Singh, K., Singh, G.P. and Singh, A.K., 2023. Genetic diversity, population structure, and genome-wide association study for the flowering trait in a diverse panel of 428 moth bean (Vigna aconitifolia) accessions using genotyping by sequencing. BMC Plant Biol., 23: 225. https://doi.org/10.1186/s12870-023-04215-w [CrossRef]
Supplementary material

Services
Article usage statistics
Loading…
Related articles
- The Analysis of Genetic Diversity of Periplaneta americanaPakistan Journal of Zoology · 2022
- UntitledSarhad Journal of Agriculture · 2019
- Parentage and Genetic Diversity Studies on Pangolin (Manis javanica) using Novel Microsatellite MarkersPakistan Journal of Zoology · 2021
- Exploring Genetic Diversity in Cotton Genotypes Using EST-SSR and ISSR Markers: A Comparative StudySarhad Journal of Agriculture · 2023
- Genetic Diversity of Gorontalo Local Cattle Based on Microsatellite DNAAdvances in Animal and Veterinary Sciences · 2023
- Analysis of Genetic Variations in Soybean using Simple Sequence Repeat (SSR) MarkersSarhad Journal of Agriculture · 2021