
A field study was implemented during the spring and autumn seasons of 2023 at Station A, located within the Field Crops Department of the College of Agricultural Engineering Sciences, University of Baghdad, Al-Jadriyah to evaluate the performance and path coefficients of introduced maize genotypes. The experiment followed a randomized complete block design with three replications, including six genotypes—five from the USA (DKC5401, DKC5783, DKC6315, DKC6590, DKC6815) and one local cultivar (Ibaa 5018). Plants were spaced at 75 cm between rows and 25 cm between plants, representing a density of 53.33 thousand plants per hectare. The assessed characteristics encompassed phenological traits (time in days to reach75% tasselling and silking) and vegetative parameters (plant height, ear height, leaf number, and leaf area), and yield-related parameters (ear length, number of rows per ear, grains per row, ear weight, cob weight, dry matter, and individual plant yield). Results indicated that total genetic correlations were negative for tasselling and silking traits (-0.286 to -0.563) and positive for plant height, ear height, number of leaves, and leaf area, with the highest correlation for number of leaves (0.852 and 0.493). Direct effects varied across traits—positive for plant height, leaf number, and leaf area, and mixed for tasselling and silking. Yield-related traits exhibited strong positive genetic correlations, especially ear weight (0.997 and 0.991). Indirect effects fluctuated between positive and negative for all growth and yield traits, indicating complex interrelationships influencing maize performance.
Research Article · Volume 39, Issue Sp. 1, Pages 75–86, 14 November 2026 · Open Access
Path Coefficient Analysis of Field Traits and Yield Components in Introduced Maize Varieties (Zea mays L.)
, ,
Affiliations & Notes ⌄
- 1Field Crops Sciences Department, College of Agriculture Engineering Sciences, University of Baghdad, Baghdad, Iraq
- *Correspondence | Banan Hassan Hadi; Email: b.h.hadi@coagri.uobaghdad.edu.iq
Article Info ⌄
- Journal:
- Pakistan Journal of Agricultural Research
- Submitted Date:
- 10 April 2026
- Accepted Date:
- 25 October 2026
- Published Date:
- 14 November 2026
Abstract
Introduction
A precise comprehension of how crop characteristics are passed down is crucial for organizing and developing structured breeding initiatives, particularly when working with traits like yield, which is the most important from the researchers . Yield is a complex quantitative trait governed by many major and minor genes, making direct improvement difficult; therefore, it is necessary to study correlated traits in maize (Zea mays L.), a cross-pollinated crop. Growth and yield components by determining the mechanism of inheritance and the nature of the genetic action controlling it, Additionally to examining the relationship and categorizing it into direct and indirect effects , presented this method for the first time when he described the relationship between the correlation and the path coefficient. This method is a closed linear system of variables that are linearly related. Any variable in this system is linearly related to some other variables or is one of the basic factors that may be linked to other independent basic factors in the system (an integrated system that includes basic factors (causative) and variables resulting from them (responsive or affected factors). Tukey (1954) and Turner et al. (1959), proposed regression paths in path analysis, and it appears that the theoretical path coefficients have a distinct descriptive value for causes similar to what is found in the case of the correlation coefficient. Wright (1960) stated that the path method deals with variables in an interrelated manner and relies on developing a qualitative diagram for each measured or theoretical variable represented by a vector that is either completely determined by other variables determined in the same way or as a basic factor. Each basic factor must be related in the diagram. Using a two-point vector with other cardinal factors to illustrate possible connections. In agricultural experiments, the path coefficient is used to identify the preferred characteristics that can be used as selection criteria to enhance production. Grain yield can be enhanced by selecting a specific yield component and partitioning its influence into direct and indirect effects and determining the main influence on the yield through the path coefficient. Through the elucidation of direct and indirect effects, the trait can be accurately diagnosed and selected . Additionally, the path coefficient is a statistical technique employed to identify and structure a cause-and-effect relationship between the causal factor and the responsive factor through a system of paths based on the results obtained from the experiment or from prior data if a series of research appears ; . The path coefficient is beneficial in identifying the characteristics that can enhance the yield, through which the direct and indirect effects of each trait of the yield are revealed that do not appear in the correlation of the phenotypic and morphological traits with the yield, so the path coefficient is used to determine them . Calculating the path coefficient is a sophisticated process that allows us to identify the fewest traits needed for selection. It shows the extent of the direct and indirect effect on the outcome, as well as the contribution of each of the studied traits to the outcome and Alshugeairy et al. (2023). Al-Zubaidy et al. (2018) indicated that information regarding direct and indirect effects is obtained by partitioning the correlations between an outcome and its components using path coefficients, this represents a higher level of complexity compared to the minimum number of characteristics required for selection, as the results of their study showed. Traits : number of days up to 50%, tassling and silking, plant height, leaf area, number of rows per ear, number of grains per row, weight of 300 grains, and grain yield per plant for twenty-one families in the first generation obtained from half-crossing between six pure lines of maize (S and IK58, OH 40 and UN44052 and ZP105). The direct effect of the tassling was 0.558 and the indirect effects differed between positive and negative values, it was through the silking negative -0.780 and the leaf area -0.107 and positive by the height -0.746 and it was The indirect effects are positive, except for leaf area and number of row grain. Wuhaib et al. (2018) found, when they studied the path coefficient for maize that the total effects were all positive, and the highest total effect was for the ear length trait (0.789), then the grain/row (0.785). As for the direct effects, there were five positive traits and two negative traits, and the highest positive value was for the trait. ear length (0.853), and in indirect effects, the highest positive value for the row grain number was with ear length (0.784). The results reached by Hadi et al. (2019) when they studied the path coefficient for maize traits showed that the highest direct effects were for plant dry weight (7.2180), the highest total effects were for crop growth rate (0.9055), and the highest positive indirect effects were between leaf area and Dry weight (9.8720). The most significant adverse indirect impact was seen in the relationship between the days required for silking and the plant's dry weight, with a value of -8.8792. Hadi et al. (2021) found, when they studied the path coefficient for maize, that the highest value of the total effect was for the ear length trait (0.7250). The tassling characteristic showed the most significant positive direct impact, with a value of 0.7830. The most significant adverse direct impact was -1.0000 for one characteristic and -0.5300 for the other. This effect occurred in the traits of silking and plant height in sequence. As for the positive indirect effects, the highest value was for the silking trait with the tassling (0.7090) and the leaf area trait with silking (0.6730). In their research, Hadi et al. (2023) discovered that the tasseling trait had the greatest positive direct effect with a value of 1.3130, while the tasseling trait also exhibited the highest negative direct effect with a value of -1.471 in their study on maize path coefficients, while the highest positive indirect effects for the tassling and silking trait were (1.130). The most significant adverse indirect impacts of the tassling characteristic on the silking characteristic were recorded at -1.470. The current study aimed to Segmentation the correlation coefficient into direct and indirect effects on growth traits and yield of introduced varieties of maize and determine the best selection criterion associated with high yield.
Materials and Methods
Soil and plant management
In order to assess the efficiency of newly introduced maize genotypes and determine their path coefficients. An experiment was conducted at Station A of the Field Crops Department within the College of Agricultural Engineering Sciences at the University of Baghdad in Al-Jadriyah, during both the spring and autumn seasons of 2023. Preparation of the experimental site for cultivation was accomplished through perpendicular tillage, followed by the smoothing and levelling of the soil according to recommendations. A randomized complete block design (RCBD) with three replications was used. The genotypes were six genotypes of maize, five of which were introduced from the United States of America: 1=DKC5401, 2=DKC5783, 3=DKC6315, 4=DKC6590, 5=DKC6815, with a local synthetic variety, Ibaa 5018 for comparison. The field was split into rows, with a 75 cm gap between each row and a 25 cm gap between individual plants, indicating a plant density of 53333 plants ha-1. Sowing involved placing 2-3 seeds in each hole, with the number of plants reduced to one per hole once they grew two leaves each. Fertilizing was carried out using 200 kg P2O5 ha-1 of triple superphosphate fertilizer before planting and 350 kg N ha-1 of urea (46% N) in three separate applications, first, two weeks post-germination, second during the elongation phase, and third at the onset of flowering. Granulated diazinon with a 10% concentration was applied at a rate of 4 kg ha-1 to control the maize stalk borer (Sesamia criteco) preventively. Throughout the two growing seasons, manual weeding, irrigation, and other field tasks were conducted as needed. Five plants from the middle of each experimental unit were randomly chosen, excluding those on the edges. The characteristics assessed included days to reach 75% maturity, tasselling and silking, plant stature, ear elevation, leaf count, and leaf area, ear length, number of rows, number of grains in the row, ear and cobs weight, dry matter weight of plant, and individual plant yield.
Path coefficient analysis
Path coefficient analysis was carried out to acquire extra insights into the relationship between characteristics and their impacts on grain yield. This technology allows the components of the genetic correlation coefficient to be divided into direct and indirect effects, which gives the relationship between traits a more precise meaning. Path coefficients were calculated according to the formula described by using the (Statistical Package Agricultural Research) program (SPAR 2.0). As a result of the limited number of traits that can be analysed in this program, the path coefficient analysis was divided into two parts, the first with field traits whose phenotypic differences are easy to distinguish. These traits are the number of days from planting tasselling and silking, plant height, ear height, number of leaves per plant, and leaves area. Additionally, the second set includes traits related to the crop components such as ear mass, ear weight, number of rows, number of grains per row, cob mass, and weight of 100 grains. The diagram that shows the causal relationship between the variables is consistent with regression analysis, and the causal relationships between the six variables and the seven variables can be explained according to the analysis in the study as follows:
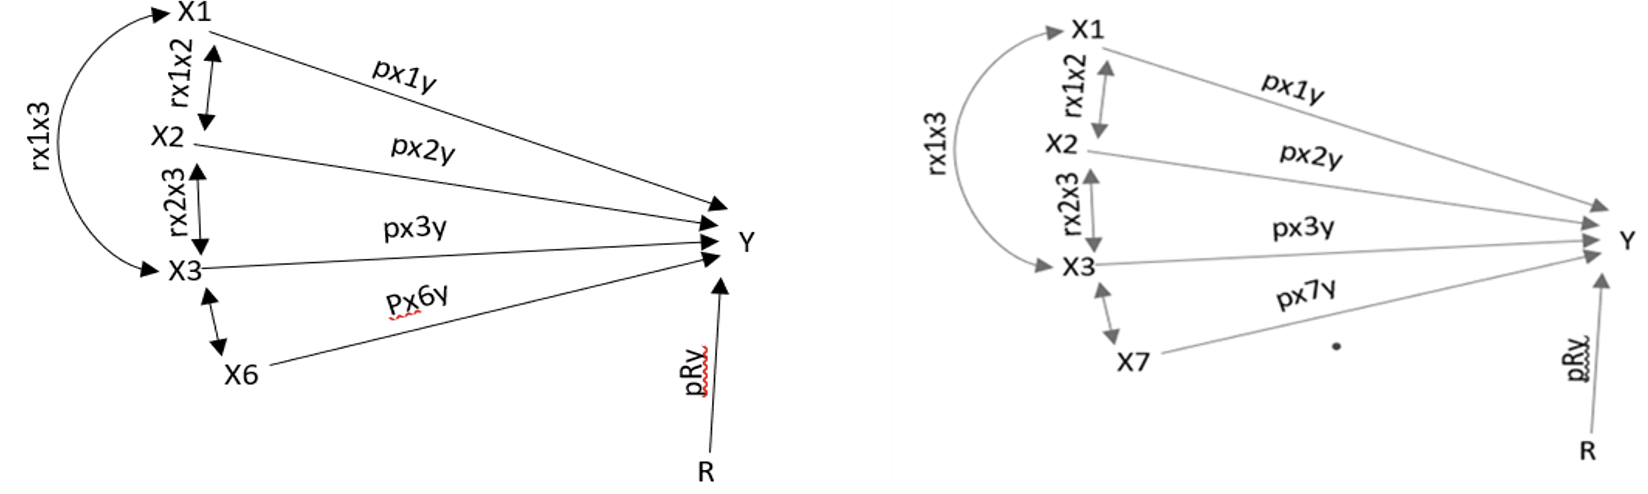
Xi refers to the independent variables, which are the seven and six characteristics included in the path factor analysis.
Y stands for the dependent variable, which is the grain yield trait.
R represents the residual variables.
The symbol → denotes a vector that signifies a path parameter from cause to effect, Pxy.
On the other hand, ↔︎ represents a vector indicating a correlation coefficient between two attributes rXiYj.
Results and Discussion
The effect of field traits on grain yield
Effect of the number of days to 75% silking (X1) on grain yield (Y)
The results of Table 1 and Figure 1 (A, B) show that the direct effects of the number of days until 75% tasselling on grain yield is both positive and negative, with values of -0.264 and 0.705, respectively. For the spring and fall seasons, respectively, the values of genetic correlations for grain yield, which represent the total effects, were negative for both seasons, reaching -0.286 and -0.563, respectively. The most significant positive indirect impacts were related to the duration between planting and tasselling, totalling 0.285. The negative effects were through plant height, which amounted to -0.343 in the spring season, while the highest positive indirect effects were through plant height, which was 1.862, and the negative effects were -2.074, through the number of days for silking in the fall season. Similar results were obtained by Al-Zubaidi at el. (2018) who indicated that the information obtained from the path coefficient is a significant step forward in determining the best criteria for selection.
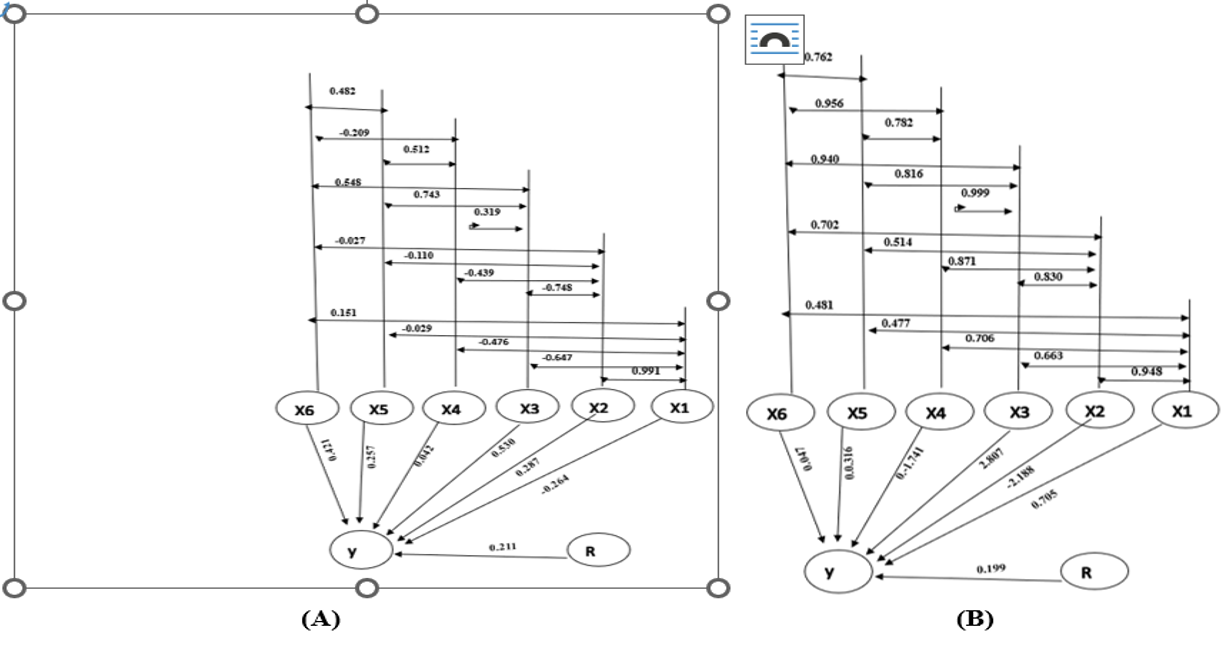
Relationship between grain yield and agronomic traits at spring (A) and fall (B) season
X1= days to tassling, X2= days to silking, X3= plant height, X4= ear height, X5= number of leaves, X6= leaf area, → = A vector representing a path parameter from cause to effect Pxy, ↔ = A vector representing a correlation coefficient between two attributes rXiYj, R= Residual
The impact of the number of days until 75% silking (X2) on grain yield (Y)
It is clear from the results of Table 1 and Figure 1(A, B) that the direct effects of the number of days from planting to 75% silking on grain yield were highly negative in the fall season. In the spring, the values were negative and positive, with -2.188 and 0.287, respectively. Genetic correlation values were negative during spring and autumn, reaching -0.428 and -0.511, respectively. It was observed that the most significant adverse indirect impacts were related to the plant's tallness during spring, whereas they were favorable during autumn, with values of -0.396 and 2.329, respectively. The characteristic of ear height was also influenced.
Table 1: Analysis of the phenotypic path coefficient of some field traits on the yield of introduced varieties of maize (X1, X2 and X3).
| Components | Coefficient values | |||
|---|---|---|---|---|
| Piy | Rij | Spring | Fall | |
| 1-effect of day to tassling (X1) in plant yield (Y) | -0.286 | -0.563 | ||
| Direct Effect | P1Y | -0.264 | 0.705 | |
| Indirect Effect by day to silking (X2) | P2Y | r12 | 0.285 | -2.074 |
| Indirect Effect by plant height (X3) | P3Y | r13 | -0.343 | 1.862 |
| Indirect Effect by ear height (X4) | P4Y | r14 | -0.020 | -1.229 |
| Indirect Effect by leaves number (X5) | P5Y | r15 | -0.008 | 0.151 |
| Indirect Effect by leaf area (X6) | P6Y | r16 | 0.063 | 0.022 |
| 2-effect of day to silking (X2) in plant yield (Y) | 0.428 | -0.511 | ||
| direct Effect | P2Y | 0.287 | -2.188 | |
| Indirect Effect by day to tassling (X1) | P1Y | r12 | -0.261 | 0.668 |
| Indirect Effect by plant height (X3) | P3Y | r23 | -0.396 | 2.329 |
| Indirect Effect by ear height (X4) | P4Y | r24 | -0.019 | -1.517 |
| Indirect Effect by leaves number (X5) | P5Y | r25 | -0.028 | 0.163 |
| Indirect Effect by leaf area (X6) | P6Y | r26 | -0.011 | 0.033 |
| 3-effect of plant height (X3) in plant yield (Y) | 0.922 | 0.023 | ||
| direct Effect | P3Y | 0.530 | 2.807 | |
| Indirect Effect by day to tassling (X1) | P1Y | r13 | 0.171 | 0.468 |
| Indirect Effect by day to silking (X2) | P2Y | r23 | -0.215 | -1.815 |
| Indirect Effect by ear height (X4) | P4Y | r34 | 0.013 | -1.738 |
| Indirect Effect by leaves number (X5) | P5Y | r35 | 0.191 | 0.258 |
| Indirect Effect by leaf area (X6) | P6Y | r36 | 0.231 | 0.044 |
Effect of plant height (X3) on grain yield (Y)
The findings presented in Table 1 and Figure 1(A, B) indicate that there were strong and positive direct impacts of plant height on grain yield. These effects were notably high, with values of 0.530 and 2.807 recorded for the spring and fall periods, respectively. Similarly, the genetic correlations showed positive associations, being high during spring (0.922) and low during fall (0.032). This is consistent with what it was concluded by Dewey and Lu (1959) and Al Najjar et al. (2016) and This suggests that the overall indirect impacts via different characteristics were positive in value, which caused these positive correlations, and the maximum positive indirect effects were through the number of days from planting to tasseling in the fall season, 0.468. The number of leaves was 0.258, and in the spring season, the highest positive indirect effects were through leaves area trait, which amounted to 0.231.
Effect of ear height (X4) on grain yield (Y)
Table 2 displays that the direct impacts of ear height on crop yield were slightly positive and significantly negative, with values of 0.042 and -1.741 during the spring and autumn periods, correspondingly. Genetic correlation coefficients for the two seasons were 0.254 and -0.054, respectively. Furthermore, the maximum indirect effects exhibited seasonal variability, fluctuating between positive and negative directions. The highest positive indirect impacts via plant height were 0.169 and 2.380 for the two different seasons. The greatest negative indirect impacts through the duration from planting to silking for spring and autumn were -0.126 and -1.906 respectively (Figure 1 A, B). These results support the conclusions reached by Hadi et al. (2019).
The impact of the quantity of leaves per plant (X5) on crop yield (Y)
The direct impact of leaf number on grain yield demonstrated positive values across both seasons, recorded at 0.257 and 0.316, respectively (Table 2). Furthermore, positive genetic correlations were observed during the spring and fall seasons, with respective values of 0.852 and 0.493. The values of the indirect effects varied between positive and negative, and the maximum value for the beneficial indirect impacts through leaf surface during the spring season was 0.852, and for plant height was 2.289 for the fall season. The highest values of negative indirect effects through the number of days from planting to tasseling and ear height reached 1.124 and -1.361 in the fall season, respectively (Figure 1. A, B)
Table 2: Analysis of the phenotypic path coefficient of some field traits on the yield of introduced varieties of maize(X4, X5 and X6).
| Components | Coefficient values | ||||
|---|---|---|---|---|---|
| Piy | Rij | Spring | Fall | ||
| 4- effect of ear height (X4) in plant yield (Y) | 0.254 | -0.054 | |||
| Direct Effect | P4Y | 0.042 | -1.741 | ||
| Indirect Effect by day to tassling (X1) | P1Y | r14 | 0.125 | 0.497 | |
| Indirect Effect by day to silking (X2) | P2Y | r24 | -0.126 | -1.906 | |
| Indirect Effect by plant height (X3) | P3Y | r34 | 0.169 | 2.803 | |
| Indirect Effect by leaves number (X5) | P5Y | r45 | 0.132 | 0.247 | |
| Indirect Effect by leaf area (X6) | P6Y | r46 | -0.088 | 0.045 | |
| 5-effevct of leaves number (X5) in plant yield (Y) | 0.852 | 0.493 | |||
| direct Effect | P5Y | 0.257 | 0.316 | ||
| Indirect Effect by day to tassling (X1) | P1Y | r15 | 0.008 | 0.336 | |
| Indirect Effect by day to silking (X2) | P2Y | r25 | -0.032 | -1.124 | |
| Indirect Effect by plant height (X3) | P3Y | r35 | 0.394 | 2.289 | |
| Indirect Effect by ear height (X4) | P4Y | r45 | 0.022 | -1.361 | |
| Indirect Effect by leaf area (X6) | P6Y | r56 | 0.852 | 0.036 | |
| 6- effevct of leaf area (X6) in plant yield (Y) | 0.779 | 0.065 | |||
| direct Effect | P6Y | 0.421 | 0.047 | ||
| Indirect Effect by day to tassling (X1) | P1Y | r16 | -0.040 | 0.339 | |
| Indirect Effect by day to silking (X2) | P2Y | r26 | -0.008 | -1.535 | |
| Indirect Effect by plant height (X3) | P3Y | r36 | 0.291 | 2.638 | |
| Indirect Effect by ear height (X4) | P4Y | r46 | -0.009 | -1.665 | |
| Indirect Effect by leaves number (X5) | P5Y | r56 | 0.124 | 0.241 | |
Effect of leaf area (X6) on grain yield (Y)
It appears from the results of Table 2 and Figure 1(A, B) that, in the spring season, there was a significant and favourable impact of leaf area on grain yield, with a value of 0.421, while in the autumn season, this effect was minor, with a value of 0.047. Positive genetic correlations were observed, yielding coefficients of 0.779 and 0.065 for the spring and fall seasons, respectively. The maximum negative indirect effects through the trait of the number of days from planting to tasselling in the spring season and the ear height in the fall season amounted to -0.04 and -1.665, respectively. The beneficial indirect impacts via plant height in the spring and autumn seasons were 0.291 and 2.638, respectively. This is consistent with the results of Hadi et al. (2018) and Wuhaib et al. (2017) who found a positive indirect effect between leaf area and plant height.
Effect of yield components on grain yield
Effect of ear weight (X1) on grain yield (Y)
The results of Table 3 show that the direct effect of ear weight on grain yield was highly positive in the spring and autumn seasons (0.728 and 1.101), respectively. The genetic correlations were strongly positive, at 0.997 and 0.997 for the spring and autumn seasons, respectively. The indirect impact was positive in the spring season varied from negative to positive in autumn. The most significant favourable indirect impact was observed through dry weight in spring and cob weight in autumn, achieving 0.55 and 0.022, correspondingly. This aligns with the findings of Hadi et al. (2023), Barto (2023), and AL-Rawi et al. (2024) who identified a beneficial secondary effect between cob weight and ear weight.
Effect of ear length (X2) on grain yield (Y)
The results of Table 3 and Figure 2 (A, B) indicate that during the spring season, the direct impact of ear length on grain yield was strongly positive, while in the autumn season, it was slightly negative (-0.176 and 0.451). The genetic correlations were very strong, with values of 0.779 for the spring and autumn seasons, respectively. The indirect effects were positive in the spring season, except for dry weight, and they differed between negative and positive for the autumn season. The most significant beneficial indirect influence was related to the ear and cob weights. Wuhaib at el. (2018) obtained similar results.
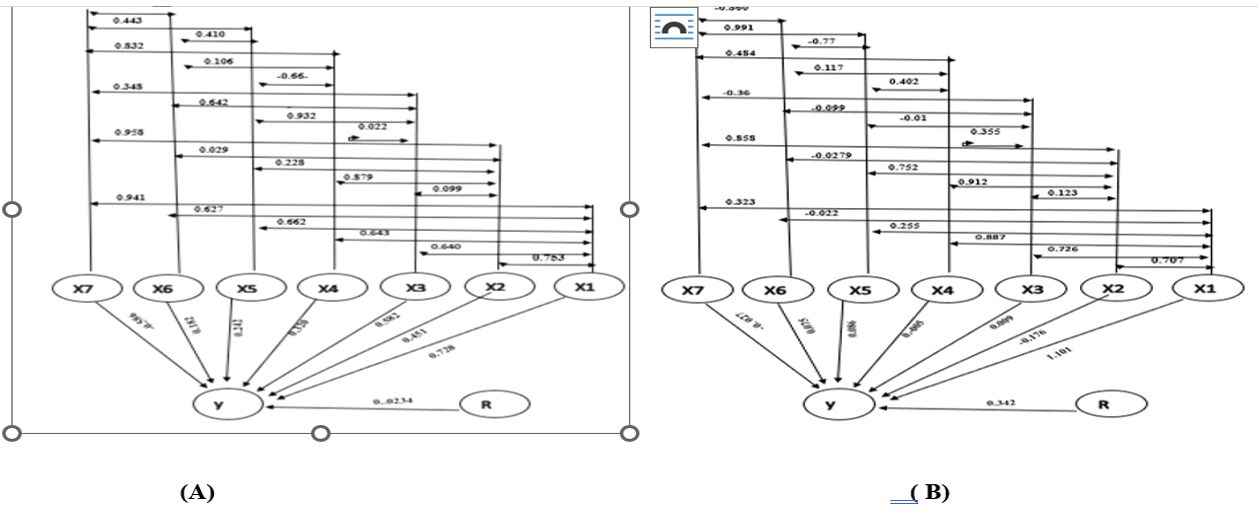
Relationship between grain yield and its primary and secondary components at spring (A) and fall (B) season
X1= ear weight, X2= ear length, X3= rows no. ear-1, X4= grain no. ear-1, X5= cob weight, X6= grain weight, X7= total dry matter, → = A vector representing a path parameter from cause to effect Pxy, ↔ = A vector representing a correlation coefficient between two attributes rXiYj, R= Residual
Table 3: Analysis of the phenotypic path coefficient of some yield components traits on the yield of introduced varieties of maize (X1, X2 and X3).
| Components | Coefficient values | |||
|---|---|---|---|---|
| Piy | Rij | Spring | Fall | |
| 1-effevct of ear weight (X1) in plant yield (Y) | 0.997 | 0.991 | ||
| Direct Effect | P1Y | 0.728 | 1.101 | |
| Indirect Effect by ear length (X2) | P2Y | r12 | 0.339 | -0.124 |
| Indirect Effect by row number of ear (X3) | P3Y | r13 | 0.002 | 0.006 |
| Indirect Effect by grain number of row (X4) | P4Y | r14 | 0.206 | -0.004 |
| Indirect Effect by cob weight (X5) | P5Y | r15 | 0.160 | 0.022 |
| Indirect Effect by weight of 100 grain (X6) | P 6Y | r16 | 0.114 | -0.002 |
| Indirect Effect by total dry matter (X7) | P7Y | r17 | 0.551 | -0.009 |
| 2-effevct of ear length (X2) in plant yield (Y) | 0.779 | 0.620 | ||
| direct Effect | P2Y | 0.451 | -0.176 | |
| Indirect Effect by ear weight (X1) | P1Y | r12 | 0.548 | 0.778 |
| Indirect Effect by row number of ear (X3) | P3Y | r23 | 0.0003 | 0.001 |
| Indirect Effect by grain number of row (X4) | P4Y | r24 | 0.281 | -0.004 |
| Indirect Effect by cob weight (X5) | P5Y | r25 | 0.06 | 0.065 |
| Indirect Effect by weight of 100 grain (X6) | P6Y | r26 | 0.005 | -0.021 |
| Indirect Effect by total dry matter (X7) | P7Y | r27 | -0.561 | -0.023 |
| 3-effevct of row number of ear (X3) in plant yield (Y) | 0.582 | 0.778 | ||
| direct Effect | P3Y | 0.003 | 0.009 | |
| Indirect Effect by ear weight (X1) | P1Y | r13 | 0.466 | 0.800 |
| Indirect Effect by ear length (X2) | P2Y | r23 | 0.045 | -0.022 |
| Indirect Effect by grain number of row (X4) | P4Y | r34 | -0.070 | -0.002 |
| Indirect Effect by cob weight (X5) | P5Y | r35 | 0.225 | -0.001 |
| Indirect Effect by weight of 100 grain (X6) | P6Y | r36 | 0.117 | -0.008 |
| Indirect Effect by total dry matter (X7) | P7Y | r37 | -0.204 | 0.001 |
The effect of the number of rows per ear (X3) on grain yield (Y)
The results indicates that the direct impact of ear length on crop production was minimal but positive during the spring and autumn periods at 0.009 and 0.003 respectively (Table 3). The genetic correlations were high and positive, at 0.582 and 0.778 for the spring and autumn seasons, respectively. The indirect impacts varied in direction between positive and negative during the spring and autumn periods. The greatest positive indirect impact was observed through the ear weight in the spring and autumn seasons, achieving 0.466 and 0.800, respectively, and the significant adverse indirect impacts were observed via the trait of dry weight and ear length, respectively, during both the spring and autumn seasons, with values of 0.548 and 0.778 correspondingly, and the maximum negative indirect effects were through the dry weight trait and the weight of the ear, respectively for two seasons(Figure,2 ). Similar results were found by Hadi et al. (2023), who noted that all yield components had direct positive effects on the seed yield, and stated that if the other components remained constant, the remaining component of the yield would contribute positively to the grain yield.
Effect of the number of grains per row (X4 )on grain yield (Y)
The results of Table 4 show that the direct effect of the number of grain row-1 on grain yield was strongly positive during spring and slightly negative during autumn (0.320 and -0.005), respectively. The genetic correlations were high and positive, amounting to 0.699 for both the spring and autumn seasons. The most significant positive indirect impacts were observed during spring and autumn for the ear weight, with values of 0.468 and 0.977, respectively. The most significant adverse indirect impact was observed via dry mass during the spring period, and through ear length for the autumn season, amounting to -0.488 and -0.160, respectively.
Table 4: Analysis of the phenotypic path coefficient of some yield components traits on the yield of introduced varieties of maize (X4, X5, X6 and X7).
| Components | Coefficient values | |||
|---|---|---|---|---|
| Piy | Rij | Spring | Fall | |
| 4- effect of grain number of row (X4) in plant yield (Y) | 0.699 | 0.845 | ||
| direct Effect | P4Y | 0.320 | -0.005 | |
| Indirect Effect by ear weight (X1) | P1Y | r14 | 0.468 | 0.977 |
| Indirect Effect by ear length (X2) | P2Y | r24 | 0.396 | -0.160 |
| Indirect Effect by row number of ear (X3) | P3Y | r34 | -0.001 | 0.003 |
| Indirect Effect by cob weight (X5) | P5Y | r45 | -0.016 | 0.035 |
| Indirect Effect by weight of 100 grain (X6) | P6Y | r46 | 0.019 | 0.009 |
| Indirect Effect by total dry matter (X7) | P7Y | r47 | -0.488 | -0.013 |
| 5-effect of cob weight (X5) in plant yield (Y) | 0.623 | 0.147 | ||
| direct Effect | P5Y | 0.242 | 0.086 | |
| Indirect Effect by ear weight (X1) | P1Y | r15 | 0.482 | 0.282 |
| Indirect Effect by ear length (X2) | P2Y | r25 | 0.103 | -0.132 |
| Indirect Effect by row number of ear (X3) | P3Y | r35 | 0.002 | -0.0001 |
| Indirect Effect by grain number of row (X4) | P4Y | r45 | -0.021 | -0.002 |
| Indirect Effect by weight of 100 grain (X6) | P6Y | r56 | 0.075 | -0.059 |
| Indirect Effect by total dry matter (X7) | P7Y | r57 | -0.259 | -0.028 |
| 6-effect of weight of 100 grain (X6) in plant yield (Y) | 0.604 | 0.053 | ||
| direct Effect | P6Y | 0.182 | 0.075 | |
| Indirect Effect by ear weight (X1) | P1Y | r16 | 0.456 | -0.025 |
| Indirect Effect by ear length (X2) | P2Y | r26 | 0.013 | 0.049 |
| Indirect Effect by row number of ear (X3) | P3Y | r36 | 0.002 | -0.001 |
| Indirect Effect by grain number of row (X4) | P4Y | r46 | 0.034 | -0.001 |
| Indirect Effect by ear weight (X5) | P5Y | r56 | 0.099 | -0.068 |
| Indirect Effect by total dry matter (X7) | P7Y | r67 | -0.183 | 0.023 |
| 7-effect of total dry matter (X7) in plant yield (Y) | 0.962 | 0.201 | ||
| direct Effect | P7Y | -0.586 | -0.027 | |
| Indirect Effect by ear weight (X1) | P1Y | r17 | 0.685 | 0.356 |
| Indirect Effect by ear length (X2) | P2Y | r27 | 0.432 | -0.151 |
| Indirect Effect by row number of ear (X3) | P3Y | r37 | 0.001 | -0.0003 |
| Indirect Effect by grain number of row (X4) | P4Y | r47 | 0.266 | -0.002 |
| Indirect Effect by ear weight (X5) | P5Y | r57 | 0.107 | 0.089 |
| Indirect Effect by weight of 100 grain (X6) | P6Y | r67 | 0.057 | -0.065 |
Effect of cob weight X5 on grain yield (Y)
The results revealed that the direct effect of the number of grains number row-1 on grain yield was positive in the spring and autumn seasons (0.242 and 0.086), respectively (Table 4). The genetic correlations were positive, high in the spring season and low at autumn season, at 0.623 and 0.147, respectively. The maximum positive indirect effects were in the spring season and the autumn season for the ear weight (0.482 and 0.282), respectively. The highest negative indirect effect was through dry weight in the spring season and through ear length for the autumn season, amounting to -0.256 and -0.132, respectively (Figure, 2 A and B).
Effect of the weight of 100 grains X6 on grain yield
As demonstrated in Table 4 and Figure 2, the 100-grain weight exerted a direct positive effect on grain yield during the spring and autumn seasons (0.182 and 0.075, respectively). The observed genetic correlations were positive, exhibiting higher magnitudes during the spring season and lower magnitudes during the autumn season, with respective values of 0.604 and 0.053. The highest positive indirect effects were in the spring season on the character of ear weight and the number of ear rows for the autumn season (0.456 and 0.049), respectively. The maximum negative indirect impact was via dry weight in the spring season and via ear weight for the autumn season, amounting to -0.183 and -0.063, respectively.
Effect of plant dry weight (X7) on grain yield (Y)
Table 4 indicates that in the spring and autumn seasons, the direct impact of dry weight on grain yield was negative, with values of -0.586 and -0.027, respectively. The genetic correlations were positive, high in the spring season and low in the autumn season, at 0.962 and 0.201, respectively. The maximum positive indirect effects were in the spring and autumn seasons for ears weight (0.685 and 0.356), respectively. The highest negative indirect impact was via ear length in the autumn season, and there was no negative indirect impact in the spring season (Figure 2).
Conclusion
We conclude from this study, which aimed to evaluate introduced varieties of maize and know the behaviour of some of the studied maize yield traits, the extent and manner of their influence, the strength of their correlation with the yield and their influence on each other, and to divide the correlation into direct and indirect effects and with what is called the path coefficient, the tasselling and silking were negatively correlated with The results for both seasons were that the traits of ear weight, number of rows, and grain weight were positively related, and the ear weight and 100 grain weight had the highest direct effect, which confirms the adoption of these traits as important selection criteria for yield in the maize crop.
Acknowledgments
The authors would like to thank the University of Baghdad for partial support of this project.
Novelty Statement
This study provides a novel insight into the genetic and physiological determinants of maize yield by applying path coefficient analysis to both field traits and yield components of introduced maize cultivars under Iraqi conditions. Unlike previous works that focused primarily on local hybrids or individual traits, this research integrates data from two growing seasons (spring and fall 2023) to dissect direct and indirect genetic impacts on grain yield. The study identifies ear weight and 100-grain weight as the most influential selection criteria for yield improvement, offering a practical framework for breeding programs targeting high-yielding, well-adapted maize cultivars in similar agro-environments.
Generative AI and AI-assisted technology statement
The authors declare that no generative AI and AI assisted technology was used in the creation of this manuscript.
Conflict of interest
The authors declare no conflict of interest.
References
- Al Najjar, R.S. Shehab, G. Al Lahham, A. Wannous, S. Al Ahmad and T. Al Henish. 2016. Path coefficient and correlation of some morphological and yield components traits in maize (Zea mays L.). Syrian J. Agric. Res., 3(2): 122-132.
- Alogaidi, F.F.Y, Al-Shugeairy, Z.K., Hadi, B.H. and Hassan, W.A., 2019. Effect of planting distance on yield and yield components of four introduced upland rice varieties under aerobic conditions. Plant Arch., 19(1): 699-607
- Alshugeairy, Z.K., Alogaidi, F.F., Hadi B.H. and Hassan W.A. 2023. Path coefficient analyses of introduced rice varieties under different planting distances. SABRAO J. Breed. Genet., 55(2): 516-524
- AL-Rawi, O.H., A.A. Bedn and M.A. Hamed. 2024. Genetic variability and path coefficient analysis for three-way cross in maize. SABRAO J. Breed. Genet., 56(1) 204-210.
- AlZubaidy, K.M.D., A.H.A. Anees, D.S.M. Al-Obaidy and M.A.H. AlJanaby. 2018. Variances, correlations and path coefficient analysis for half diallel crosses in maize (Zea mays L.) and its effects by plant spaces. J. Kerbala Agric. Sci., Third Sci conf. 5-6th March, 2016. College of Agriculture, University of Kerbala.
- Barto, E.F. 2023. Evaluating the performance of selected double hybrids of maize for sowing dates in autumn season and estimation some of their genetic parameters. MSc. Thesis., College of Agricultural Engineering Science, University of Baghdad. pp. 130.
- Dewey, D.R. and Lu, K.H. 1959. A correlation and path coefficient analysis of components of crested wheatgrass seed production. Agron. J. 51: 515-518.
- Drikv and, R., Samiei, K. and Hossinpor, T. 2011. Path coefficient in analysis in hullless barley under rainfed condition. Aust. J. Basic Appl. Sci., 5(12): 277-279.
- Hadi, B.H., Hassan, W.A. and Abed-Alamir, A.N. 2018. Evaluation the Performance of double, single hybrids and inbred of maize under different plant population and estimation heterosis and hybrid vigor. Interact. Environ. Global Climate Change, 6(2): 76-93.
- Hadi, B.H., Hassan, W.A. and Wuhaib, K.M. 2019. Phenotypic, genotypic correlation and path coefficient for several traits of maize under watered and water stress (agronomic traits). Plant Arch., 19(2): 4179-4188.
- Hadi, B.H., W.A. Hassan and M.S.H. Hamdalla. 2021. Some genetic parameters and path coefficient of three-way crosses in maize. IOP Conf. Ser.: Earth Environ. Sci.
- Hadi, B.H., W.A. Hassan and M.S.H. Hamdalla. 2023.Performance of some three-way cross hybrids and their parents of maize in the middle region of Iraq. IOP Conf. Series: Earth and Environmental Science.
- Rafique, M., Shahzad, A., Mallhi, A.R., Abbas, M., Mughal, K.M. and Yousaf, M.L. 2022. Assessment of heritabillty, correlation and path coefficient analysis for yield associated traits in newly synthesized corn (Zea mays L.). Hybrids. J. Agric. Res., 58(4): 233-237.
- Samonte, S., Wilson, O.P. and Mcclung, A.M. 1998. Path analysis of yield and yield-related traits of fifteen diverse rice genotypes. Crop Sci., 38(5): 130-136.
- Sinebo, W. 2002. Yield relationships of barleys grown in a tropical highland environment. Crop Sci., 42: 428-437.
- Tukey, J.W. 1954. Causation, regression, and path analysis, in statistics and mathematics in biology, pp.35-66.
- Turner, M.E. and Stevens C.D. 1959. The regression analysis of causal path. Biometrics. 15: 236-258.
- Wright, S. 1921.Correlation and causation. J.Agric.Res.20:557-587.
- Wright, S. 1960. Path coefficient and path regression: Alternative or complementary concepts? Biometrics, 16:189-202.
- Wuhaib, K.M., Hadi, B.H. and Hassan, A. 2018. Estimation of genetic parameters and path coefficient for growth traits, yield and its components for parents and hybrid of maize. Iraqi J. Agric. Sci. 22(10): 142-151.
- Wuhaib, K.M., W.A. Hassan and B.H. Hadi .2017. Genotypic, phenotypic correlation and path coefficient in maize. II- yield and yield components. Iraqi J. Agri. Sci. 48(3):885-891.
- Wuhaib, K.M. 2001.Evaluation of Maize Genotypes Responses to Different Fertilizer and Plant Population and Path Coefficient Analysis. PhD dissertation. Department of Field Crop Science, College of Agriculture, University of Baghdad, Iraq. pp. 173.

Services
Article usage statistics
Loading…
Related articles
- Genetic Variability, Traits Association and Path Coefficient Analysis in Advanced Lines of Groundnut (Arachis hypogaea L.)Journal of Innovative Sciences · 2021
- Genetic Analysis of Yield and its Contributing Traits in Maize (Zea mays L.)Sarhad Journal of Agriculture · 2019
- Determination of Genetic Variation and Association Analysis of Yield Contributing Traits for Suitable Selection Criteria in ChickpeaSarhad Journal of Agriculture · 2022
- Performance Evaluation, Estimation of Genetic and Phenotypic Correlation Coefficients, and Path Coefficient Analysis of Quantitative Traits in Triticale Genotypes Grown under Different Seeding RatesPakistan Journal of Agricultural Research · 2026
- Evaluation of Field Pea (Pisum sativum L.) Varieties for Yield and Yield-Related TraitsSarhad Journal of Agriculture · 2022
- Combining Ability Analysis for Morphological Traits in 6 × 6 Diallel Crosses of Maize (Zea Mays L.) Opvs in Nowshehra (KPK) PakistanSarhad Journal of Agriculture · 2019