
This study evaluated differences in performance, nutrient utilisation, welfare indicators, and physiological responses of Sentul chickens across five rearing conditions and two dietary profiles. We allocated 250 two-month-old female Sentul chickens according to a 5×2 factorial design, with five replicates and five birds per experimental unit. Rearing conditions included rice husk litter, straw litter, sawdust litter, wooden cages, and wire cages. Diet R1 contained 20% crude protein and 3,100 kcal/kg of metabolizable energy, while diet R2 contained 22% crude protein and 2,800 kcal/kg of metabolizable energy. The analysis indicated that the dietary profile influenced final body weight, body weight gain, feed intake, and feed conversion ratio (FCR), with better growth and FCR observed under diet R1. No significant interaction was found for final body weight (P=0.671) or daily body weight gain (P=0.916). Descriptively, the FCR values across treatment combinations ranged from 3.24 (wooden cage with diet R1) to 4.11 (straw litter with diet R2). In the litter-reared groups, the activity index was approximately 49–52%, while natural behaviours accounted for about 38–41%; comparing litter-based systems with cages requires specific contrasts or adjusted pairwise tests. Rearing conditions were associated with variations in behavioural indicators, integument condition, and biomarkers of stress and oxidative status. These differences cannot be attributed solely to flooring material, as treatments also varied in cage structure and substrate access. Similarly, the simultaneous variation in energy and protein levels limits inferences about the two complete dietary formulations. A feed conversion ratio (FCR) of 3.24 was achieved by chickens housed in wooden cages and fed diet R1. The findings provide context for evaluating Sentul chicken management, but they do not yet establish an optimal treatment combination or the underlying causal mechanisms.
Research Article · Volume 14, Issue 12, Pages 2755–2762, 5 November 2026 · Open Access
Interactive Effects of Housing Materials and Dietary Energy-Protein Profiles on Biological Characteristics, Welfare, and Productive Performance of Sentul Chickens
· ·
Affiliations & Notes ⌄
- 1Department of Livestock Production, Faculty of Animal Husbandry, Padjadjaran University, Jl. Ir. Soekarno KM. 21, Jatinangor-Sumedang, West Java 45363, Indonesia
- 2Department of Animal Nutrition and Feed Technology, Faculty of Animal Husbandry, Padjadjaran University, Jl. Ir. Soekarno KM. 21, Jatinangor-Sumedang, West Java 45363, Indonesia
- *Correspondence | Tuti Widjastuti; Email: tuti.widjastuti@unpad.ac.id
Article Info ⌄
- Journal:
- Advances in Animal and Veterinary Sciences
- Submitted Date:
- 27 September 2026
- Accepted Date:
- 22 October 2026
- Published Date:
- 5 November 2026
Abstract
Introduction
Sentul chickens are a valuable local Indonesian poultry genetic resource for meat production, germplasm conservation, and developing regionally based livestock businesses. These advantages require a husbandry system that can maintain the chickens’ growth, health, and well-being simultaneously. Sentul chickens respond differently from commercial chickens because of differences in genetic background, growth rate, and adaptability. Recent studies on Sentul chickens also show that early biological factors can influence muscle development and post-hatch responses . Therefore, management evaluations during the growth phase must be conducted specifically, rather than simply adopting commercial broiler standards.
Rearing conditions include housing systems, floor surfaces, and access to substrate. Litter can provide opportunities for foraging and dust bathing. At the same time, variations in moisture levels, cleanliness, and the nature of contact between the birds’ feet and the floor surface may relate to welfare indicators. Since three types of litter were compared across two housing systems, this factor cannot be defined solely as “litter material.” Differences in observed responses must be interpreted as differences between the overall rearing conditions. Examining the rearing environment provides the necessary context for this assessment .
This study compares R1 (20% crude protein; 3,100 kcal/kg metabolizable energy) with R2 (22% crude protein; 2,800 kkal/kg metabolizable energy) two complete ration formulations with differing energy and protein densities. This approach allows evaluation of responses to two practical dietary profiles, rather than independent assessments of specific energy or protein requirements. Previous research indicates that variations in energy and protein levels can influence both poultry performance and physiological indicators ; . However, these references do not establish the specific requirements for Sentul chickens at the age examined in this study.
Performance evaluations must be considered alongside behavioural, metabolic, stress, and oxidative indicators, as growth alone does not capture all aspects of animal welfare. Furthermore, every biomarker has limitations regarding specificity and does not necessarily pinpoint the underlying physiological mechanisms. Poultry nutrition research provides context for these relationships ; .
This study addresses a research gap by examining how these two ration formulations relate to performance and welfare indicators in female Sentul chickens across five rearing conditions within a single experimental design. The study examines the main effects of rearing conditions and dietary profiles, as well as their interactions. Its contribution lies in providing specific evidence for the population and conditions studied, rather than discovering a new mechanism simply because many parameters were measured. The working hypothesis posits differences in response between rearing conditions and among dietary profiles; statistical testing must determine whether an interaction exists, rather than assuming it based on differences in the mean values of the combinations.
MATERIALS AND METHODS
Experimental animals and treatment design
The study used 250 two-month-old female Sentul chickens with an average initial body weight of 1,042 ± 34.92 g, allocated in a 5×2 factorial design. The first factor included five rearing conditions, and the second comprised two dietary profiles. Each combination included five replicates of five birds, for a total of 50 experimental units. The rearing conditions included rice husk, straw, or sawdust as litter, and wooden- or wire-floored enclosures. Diet R1 contained 20% crude protein and 3,100 kcal/kg of metabolizable energy, whereas diet R2 contained 22% crude protein and 2,800 kcal/kg of metabolizable energy. We randomly assigned the chickens after an initial weighing.
We provided feed and drinking water ad libitum. The rearing condition factor included three litter systems (rice husk, straw, and sawdust) and two enclosure systems (wooden and wire-floored). Each experimental unit measured 1.5 × 1.0 m and housed five birds, providing a nominal space of 0.30 m² per bird; the litter depth was 10 cm. All experimental units were housed within a building measuring 30 × 8 m. Throughout the study, we recorded an average temperature of 27°C and humidity of 82.5%.
Blood sampling
We collected blood at the end of the study period, after performance measurements were completed. We randomised the sampling sequence across treatments, and standardised collection timing to minimise circadian variation. We randomly selected three chickens from each experimental unit and drew 3 mL of blood from the brachial vein in the morning, before providing feed. We placed a portion of the blood in an EDTA-containing tube for a differential leukocyte count and to determine the heterophil/lymphocyte (H/L) ratio. We placed the remainder in a tube without an anticoagulant to obtain serum.
The serum samples were left to clot for 4 hours, centrifuged at 3,500 rpm and 5°C for 10 minutes, and the supernatant was then transferred into sterile microcentrifuge tubes. We coded the samples to keep the laboratory analyst unaware of the treatment identities.
Sample analysis and data recording
We recorded body weight at the beginning and end of the period. We calculated daily weight gain by dividing the difference between final and initial body weight by the experiment duration. We determined feed consumption by subtracting the remaining feed from the total amount provided, and we calculated the feed conversion ratio (FCR) as feed consumption divided by weight gain over the same period. We calculated energy and protein intake based on feed consumption and ration composition. During the fourth month, we isolated two chickens from each experimental unit for 24 hours and placed them in metabolic cages to collect faecal samples. Nitrogen retention was calculated as 100 × (N consumed – N excreted) / N consumed. We based the entire N retention procedure on the method described by Rusmana et al. (2026).
Welfare assessments were conducted for each experimental unit. Observed parameters included an activity index, natural behaviours, tonic immobility duration, feather condition, and footpad condition. Each pen served as the unit of observation, and we aggregated individual measurements to represent that pen.
We observed the activity and natural behaviours of all sampled chickens within each unit via CCTV recordings every Monday and Thursday. We expressed the activity index as the percentage of valid observations in which the chickens were actively moving. Tonic immobility was assessed by measuring the time elapsed from the release of the chicken after being restrained in a supine (on-the-back) position until it returned to a standing posture. We evaluated feather and footpad conditions based on feather integrity and the presence and severity of any lesions. Behavioural data from Mondays and Thursdays were averaged to derive a weekly value for each pen. Observations taken over successive weeks within the same pen are treated as repeated measurements.
Serum analysis included glucose, triglycerides, total protein, albumin, and uric acid as indicators of energy and protein metabolism. Corticosterone indicated the endocrine stress response, while the H/L ratio was obtained from the leukocyte differential count. We assessed immune status by measuring IgG concentration. We determined oxidative status using malondialdehyde (MDA) as an indicator of lipid peroxidation and superoxide dismutase (SOD) and glutathione peroxidase (GPx) activities as components of antioxidant defence. We performed biochemical analyses spectrophotometrically using commercial reagents or validated methods, and determined corticosterone and IgG by immunoassay/ELISA according to the MyBiosource Kit manufacturer’s instructions (USA), ID Kit MBS260991 and MBS760369, respectively.
We recorded all data at the experimental unit level. For variables measured on individuals, we summarised individual values within a replicate to unit values before factorial analysis to maintain independence among experimental units. We checked data for entry errors, values outside the biological range, and completeness before analysis. We removed no values simply because they yielded differences inconsistent with the hypothesis; any exclusions were based on predetermined criteria and were reported transparently.
Statistical analysis
The primary analysis uses a factorial model: Yijk=µ+Hi+Dj+(H×D)ij+εijk, where Hi is housing material (i=1–5), Dj denotes the dietary profile (j=1–2), and k=1–5 indicates the replicates for each combination. Each pen serves as an independent unit (n=50). For continuous parameters measured at the individual level, we used mean values per pen (based on the birds within). We used LISREL v5.0 to assess residual normality (Q–Q plots and the Shapiro–Wilk test) and homogeneity of variance (residual plots and Levene’s test), and to perform any necessary data transformations.
As an integrative analysis, we performed a path analysis with FCR as the outcome. We treated housing system and energy–protein profile as exogenous variables, while nitrogen retention and a physiological stress index served as mediators. We calculated the physiological stress index as the mean z-score of corticosterone, H/L ratio, and MDA after adjusting all components so that higher values indicated greater physiological stress. We report path coefficients as standardised coefficients (β) with P values, and express the proportion of variation in FCR explained by the model as R². We evaluated non-significant paths to maintain the model’s biological interpretability but visually distinguished them from significant paths. Because the path analysis was exploratory, we did not interpret associations between variables as evidence of causality.
RESULTS AND DISCUSSION
Productive performance and nutrient utilisation
The interaction between rearing conditions and rations was not significant for final body weight (P=0.671) or average daily gain (P=0.916); therefore, we interpreted both outcomes based on their main effects. The ration profile influenced final body weight (P<0.001), while rearing conditions had a P-value of 0.069. Both rearing conditions (P=0.018) and ration (P<0.001) influenced average daily gain. R1 resulted in higher growth than R2. The ration affected feed intake and the feed conversion ratio (FCR) (P<0.001), while rearing conditions also influenced the FCR (P<0.001). The FCR values of 3.24 for the wood-based condition with R1 and 4.11 for the straw-based condition with R2 describe specific combinations, not evidence of an interaction or a significant difference between the pairs.
Table 1: Effects of housing material and dietary energy-protein profile on productive performance and nutrient utilisation.
| Parameteres | Rice husk | Straw | Sawdust | Wood Cage | Wire Cage | P-values | |||||||
| R1 | R2 | R1 | R2 | R1 | R2 | R1 | R2 | R1 | R2 | P_H | P_D | P_H×D | |
| Final body weight (g) | 1713.1± 26.3ab |
1676.0± 15.7abc |
1685.4± 13.7abc |
1612.0± 22.3c |
1721.8± 19.8a |
1635.7± 17.8bc |
1727.8± 11.1a |
1654.5± 9.9abc |
1717.4± 14.6a |
1653.9± 9.1abc |
0.069 | <0.001 | 0.671 |
| Feed intake (g) | 2993.9± 30.8b |
3349.3± 79.5a |
3028.4± 38.7b |
3305.4± 59.0a |
2979.2± 27.5b |
3305.7± 64.2a |
2979.2± 43.5b |
3272.8± 38.7a |
2981.9± 40.1b |
3300.2± 17.1a |
0.859 | <0.001 | 0.934 |
| Feed conversion ratio | 3.32± 0.02e |
3.98± 0.03bc |
3.44± 0.02d |
4.11± 0.01a |
3.35± 0.01de |
4.07± 0.05ab |
3.24± 0.01e |
3.89± 0.03c |
3.31± 0.01e |
3.93± 0.01c |
<0.001 | <0.001 | 0.334 |
| Energy intake (kcal) | 9281.0± 95.5a |
9377.9± 222.5a | 9388.2± 120.0a |
9255.1± 165.3a |
9235.4± 85.4a |
9255.9± 179.8a |
9235.6± 135.0a |
9163.8± 108.5a |
9243.8± 124.4a |
9240.5± 47.8a |
0.854 | 0.835 | 0.933 |
| Protein intake (g) | 598.8± 6.2b | 736.8± 17.5a | 605.7± 7.7b |
727.2± 13.0a |
595.8± 5.5b |
727.2± 14.1a |
595.9± 8.7b |
720.0± 8.5a |
596.4± 8.0b |
726.1± 3.7a |
0.863 | <0.001 | 0.934 |
| Nitrogen retention (%) | 67.4± 1.1a |
60.5± 1.0bc |
64.1± 0.7ab |
59.5± 1.3bc |
61.8± 0.8bc |
59.9± 1.4bc |
63.4± 1.5abc |
58.9± 0.4bc |
60.8± 1.4bc |
58.4± 1.3c |
0.009 | <0.001 | 0.222 |
Values are mean±SEM (n=5 independent units per treatment combination). Within each row, means without a common superscript letter differ at P<0.05 (Tukey HSD). R1 = 20% crude protein and 3,100 kcal ME/kg; R2 = 22% crude protein and 2,800 kcal ME/kg. P-values are from the balanced 5×2 factorial model (housing material, diet, and their interaction). P_H = housing material effect; P_D = diet effect; P_H×D = housing material × diet interaction.
Energy intake did not differ significantly by rearing condition, diet provided, or their interaction (P>0.05). The higher feed consumption observed for the R2 diet is consistent with a potential compensatory response to its lower energy density; however, the lack of a significant difference in energy intake does not imply biological equivalence. Protein intake was higher for the R2 diet (P<0.001). Nitrogen (N) retention was influenced by both rearing condition (P=0.009) and diet (P<0.001), with values of 67.35% for the rice-husk-litter/R1-diet combination and 58.38% for the wire-flooring/R2-diet combination. These values should be considered preliminary, pending verification of the excreta collection methods and N-balance calculations; they cannot be used to establish the superiority of a specific combination or to determine the mechanisms underlying protein deposition. Previous studies provide context regarding the relationship between nutritional profiles and nitrogen utilisation ; .
A lower feed conversion ratio (FCR) indicates less feed consumed per unit weight gain; however, this does not necessarily reflect higher energy-use efficiency, as the two diets differed in energy density. Evaluating energy efficiency requires calculating metabolizable energy intake per unit weight gain, along with appropriate measures of uncertainty and statistical testing. Furthermore, differences in feed wastage between housing types can bias consumption and FCR data if not properly corrected. In the absence of comprehensive compositional data along with measurements of protein deposition or amino acid metabolism observed responses cannot be definitively attributed to specific factors such as energy, protein, deamination, or tissue deposition. This discussion is framed within nutritional research on local chicken breeds ; .
Behavioural expression and welfare status
Preliminary analysis indicates that rearing conditions significantly affect activity indices and the expression of natural behaviours (P<0.001), whereas dietary profiles and their interactions are not statistically significant (P>0.05). Groups housed on litter exhibited activity indices of approximately 49–52% and natural behaviour levels of around 38–41%. These ranges are descriptive statistics for the groups, not evidence of specific contrasts between litter-based and wire-floored housing or pairwise comparisons. Access to a substrate directly determines opportunities for foraging and dustbathing; however, lower frequencies of these behaviours in substrate-lacking environments do not, by themselves, confirm compromised physiological welfare. Future research should verify the equivalence of effective space and incorporate analyses of repeated observations.
Tonic immobility varied significantly by rearing condition (P<0.001) and dietary profile (P=0.003). The values 66.70 seconds for the litter–R1 combination and 139.16 seconds for the wire-floor–R2 combination are descriptive; they do not establish specific pairwise differences or identify an optimal combination. Rearing conditions also significantly affected feather and footpad scores (P<0.001); however, determining which condition is superior requires a clear definition of the scoring direction, appropriate ordinal or proportional analysis, and adjusted comparisons. Previous studies support assessing welfare through various environmental and integument-related indicators .
Table 2: Effects of housing material and dietary energy-protein profile on behavioural expression and welfare status.
| Parameteres | Rice husk | Straw | Sawdust | Wood Cage | Wire Cage | P-values | |||||||
| R1 | R2 | R1 | R2 | R1 | R2 | R1 | R2 | R1 | R2 | P_H | P_D | P_H×D | |
| Activity index (%) | 50.5± 0.7a |
52.3± 0.4a |
49.4± 0.7a |
48.8± 0.6a |
50.1± 0.8a |
48.9± 0.7a |
11.8± 1.3bc |
12.7± 1.4b |
8.2± 1.0c |
11.4± 1.1bc |
<0.001 | 0.158 | 0.152 |
| Natural behaviour (%) | 39.6± 0.8a |
40.8± 0.8a |
40.0± 0.3a |
38.6± 0.8a |
38.3± 0.5a |
38.6± 0.7a |
13.0± 0.6b |
15.1± 1.5b |
13.4± 0.9b |
12.8± 0.9b |
<0.001 | 0.507 | 0.258 |
| Tonic immobility (s) | 66.7± 9.0c |
85.3± 8.7bc |
89.0± 6.4bc |
112.2± 6.9ab |
93.8± 8.4bc |
89.3± 6.7bc |
108.3± 3.5ab |
132.1± 9.6a |
130.3± 2.2a |
139.2± 4.2a |
<0.001 | 0.003 | 0.233 |
| Feather score | 0.52± 0.07bc |
0.43± 0.13c |
0.59± 0.08bc |
0.79± 0.07abc |
0.43± 0.09c |
0.52± 0.07bc |
0.72± 0.10abc |
0.71± 0.07abc |
0.90± 0.02ab |
1.08± 0.07a |
<0.001 | 0.164 | 0.376 |
| Footpad score | 0.38± 0.10d |
0.46± 0.15d |
0.95± 0.10bc |
1.12± 0.05ab |
0.65± 0.04cd |
0.66± 0.11cd |
0.65± 0.08cd |
0.89± 0.10bc |
1.45± 0.09a |
1.26± 0.01ab |
<0.001 | 0.269 | 0.182 |
Values are mean±SEM (n=5 independent units per treatment combination). Within each row, means without a common superscript letter differ at P<0.05 (Tukey HSD). R1 = 20% crude protein and 3,100 kcal ME/kg; R2 = 22% crude protein and 2,800 kcal ME/kg. P-values are from the balanced 5×2 factorial model (housing material, diet, and their interaction). P_H = housing material effect; P_D = diet effect; P_H×D = housing material × diet interaction.
Table 3: Effects of housing material and dietary energy-protein profile on immunometabolic, stress and oxidative status.
| Parameteres | Rice husk | Straw | Sawdust | Wood Cage | Wire Cage | P-values | |||||||
| R1 | R2 | R1 | R2 | R1 | R2 | R1 | R2 | R1 | R2 | P_H | P_D | P_H×D | |
Uric acid (mg/dL) |
6.39± 0.15bc |
7.21± 0.19a |
6.27± 0.10c |
7.04± 0.17ab |
6.23± 0.15c |
6.82± 0.14abc |
6.16± 0.11c |
7.25± 0.12a |
6.25± 0.14c |
7.20± 0.18a |
0.419 | <0.001 | 0.523 |
| Corticosterone (ng/mL) | 4.81± 0.22ef |
5.17± 0.16def |
5.61± 0.15cde |
5.89± 0.10cd |
4.52± 0.19f |
5.45± 0.24cdef |
6.27± 0.27c |
6.36± 0.10bc |
7.28± 0.32ab |
7.59± 0.17a |
<0.001 | 0.004 | 0.330 |
| H/L ratio | 0.37± 0.01e |
0.42± 0.02cde |
0.43± 0.01cde |
0.49± 0.02bc |
0.39± 0.02de |
0.46± 0.02cd |
0.48± 0.03bcd |
0.49± 0.01bc |
0.56± 0.02b |
0.65± 0.00a |
<0.001 | <0.001 | 0.334 |
IgG (mg/mL) |
7.89± 0.12a |
7.80± 0.26ab |
7.53± 0.07ab |
7.66± 0.17ab |
7.39± 0.09ab |
7.50± 0.21ab |
7.30± 0.09ab |
7.28± 0.15ab |
7.14± 0.12b |
7.21± 0.13ab |
<0.001 | 0.684 | 0.947 |
MDA (nmol/mL) |
2.66± 0.08bc |
2.54± 0.09c |
2.72± 0.10bc |
2.81± 0.08bc |
2.74± 0.06bc |
2.76± 0.10bc |
2.88± 0.03abc |
3.05± 0.08ab |
3.28± 0.15a |
3.28± 0.13a |
<0.001 | 0.589 | 0.657 |
SOD (U/mL) |
118.3± 2.6a | 117.4± 1.5a |
110.3± 2.1ab |
108.8± 2.1b |
111.8± 1.5ab |
112.3± 1.8ab |
110.5± 1.0ab |
108.9± 0.9b |
108.5± 2.1b |
105.7± 1.4b |
<0.001 | 0.270 | 0.919 |
GPx (U/L) |
172.3± 3.0ab |
173.7± 2.7a |
163.4± 4.7abc |
161.2± 1.6abc |
160.2± 3.2bc |
163.5± 2.6abc |
160.5± 1.2bc |
156.1± 3.4c |
157.1± 1.2c |
154.2± 2.2c |
<0.001 | 0.599 | 0.624 |
Values are mean±SEM (n=5 independent units per treatment combination). Within each row, means without a common superscript letter differ at P<0.05 (Tukey HSD). R1 = 20% crude protein and 3,100 kcal ME/kg; R2 = 22% crude protein and 2,800 kcal ME/kg. P-values are from the balanced 5×2 factorial model (housing material, diet, and their interaction). P_H = housing material effect; P_D = diet effect; P_H×D = housing material × diet interaction.
Welfare assessment must distinguish between the opportunity to perform natural behaviours, fear responses during testing, integument condition, and physiological biomarkers. The observed relationships between these outcomes do not necessarily prove that restricted movement leads to neuroendocrine or metabolic alterations. Factors such as litter quality, effective space, microclimate, health status, and handling may also contribute to these results. The environmental study of Sentul chickens provides context , but it does not isolate these factors in the current study’s design.
Immunometabolic, stress and oxidative status
Initial analysis indicates that rearing condition affects glucose levels (P=0.028). Group R2 showed lower triglyceride levels (P<0.001) and higher total protein (P<0.001), albumin (P=0.001), and uric acid (P<0.001). These changes reflect differences in serum metabolite concentrations across formulations, though they do not directly measure protein deposition or nitrogen metabolic flux. Because energy, protein, and potentially ingredient composition vary simultaneously, we cannot isolate each component’s contribution.
Corticosterone levels differed by both rearing condition (P<0.001) and ration (P=0.004), with a range from 4.52 ng/mL (sawdust–R1) to 7.59 ng/mL (wire flooring–R2). The heterophil-to-lymphocyte (H/L) ratio also showed significant effects of both rearing condition and ration (P<0.001). Although both indicators reflect variation in the stress response, they are not specific to chronic stress induced by housing; however, housing conditions and rations have been documented as factors that can elevate these hormones ; .
Rearing condition significantly affected IgG-labeled immunoglobulins, MDA, SOD, and GPx (P < 0.001), whereas the ration and the interaction between factors were not significant. Immunoglobulin concentrations alone do not confirm enhanced immune protection in the absence of functional assays. Descriptive differences between rice husks and wire flooring are insufficient to establish superiority without corrected pairwise comparisons. Literature on poultry immunology and antioxidants supports the general discussion, but it does not validate the specific immune functions or molecular pathways reported in this research ; .
MDA is interpreted as an indicator of lipid peroxidation, while SOD and GPx reflect the activity of antioxidant defence components. Increased enzyme activity may reflect an adaptive response to oxidative challenge and therefore does not necessarily indicate better physiological status. Assessing these variables also depends on sampling conditions and analytical quality.
Limitations in inferring relationships between rearing conditions, ration profiles, and FCR
The path analysis presented in the initial version is not retained as an inferential result. Because individual-unit data were not included, it remains unclear whether the estimates were derived from 50 independent plots or from the means of ten combinations. Using combined means alters the effective sample size and can lead to unstable estimates. Furthermore, collapsing five conditions into two categories eliminates inter-condition variation and requires both explicit justification and clear coding.
We excluded the R² value of 0.970 and the direct coefficient for the ration profile (β = 0.943) from the initial version of the conclusions because we have no information on standard errors, confidence intervals, multicollinearity checks, residual analysis, or model fit. A high R² value does not establish biological validity or a causal relationship. These figures are mentioned solely to clarify the limitations in interpreting the previous model.
We measured stress biomarkers at the end of the study, whereas the feed conversion ratio (FCR) summarises performance over the entire period. The temporal sequence between the mediator and the outcome has not been established; therefore, there is no sufficient basis to conclude that physiological mediation occurred. The previously reported pathway from nitrogen (N) retention to FCR was non-significant (β=0.008; P=0.817), which also does not support the claim of nitrogen-based mediation. Differences in FCR are discussed based on treatment comparisons within a factorial design, involving concurrent energy–protein restriction and maintenance conditions that encompass multiple attributes.
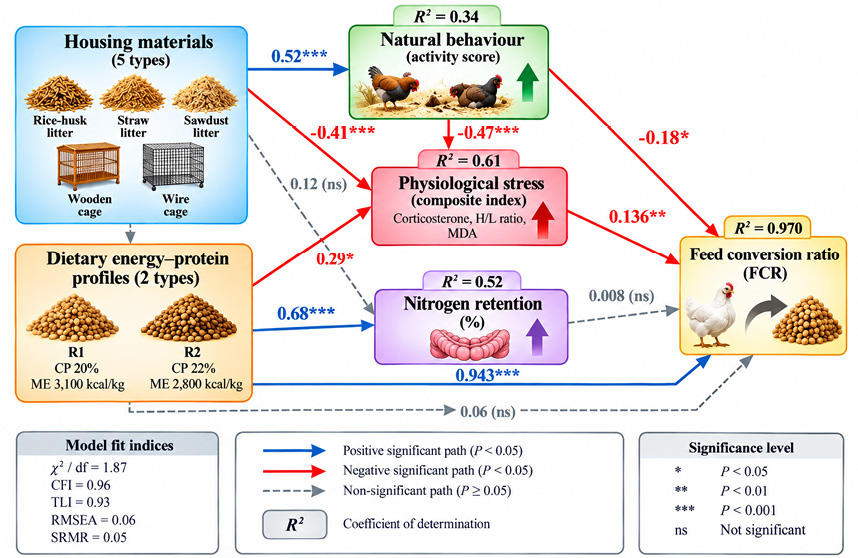
Exploratory framework of the relationships among housing material, dietary energy–protein profile, nitrogen retention, physiological stress index, and FCR.
CONCLUSION
Based on the reported results, R1 (20% crude protein; 3,100 kcal/kg metabolizable energy) showed better growth and feed conversion than R2 (22% crude protein; 2,800 kcal/kg metabolizable energy) under the conditions of this study. The experimental design did not isolate the individual contributions of energy, protein, or the specific ingredients comprising the rations. The five rearing conditions differed in behaviour, integument condition, and physiological biomarkers; however, the substrate’s influence could not be disentangled from the effects of enclosure structure and surface characteristics. The lack of significant interaction effects on final body weight and daily weight gain does not support the claim of an optimal combination for these two outcomes.
ACKNOWLEDGEMENTS
The author thanks Padjadjaran University for financial support through the ALG grant scheme (contract number: 3149/UN6.J/PT.00/2025). Padjadjaran University funded all research activities underlying this work as part of its institutional support for implementing and developing research activities.
NOVELTY STATEMENT
The research contribution lies in comparing two complete ration formulations under five rearing conditions for female Sentul chickens, all within the same experimental context. These findings are specific to the population and conditions under observation, highlighting the need to evaluate performance alongside behavioural opportunities and physiological indicators. Although we measured multiple outcomes, this does not constitute mechanistic novelty; the study does not independently establish energy or protein requirements, the isolated effects of flooring materials, or the role of stress as a mediator of the feed conversion ratio (FCR).
AUTHORS’ CONTRIBUTION
All authors listed in this article contributed equally, from planning and implementation to writing.
Ethical approval
All research procedures involving animals have been reviewed and approved by the Animal Welfare and Ethics Assessment Authority, Animal Experiment Ethics Agency, Ministry of Agriculture of the Republic of Indonesia, in accordance with applicable animal welfare standards and ethical principles in animal research. Ethical approval was granted based on Certificate Number 0956/KEP.06a/KEP/09/2025.
Generate AI and AI-assisted technology statement
The authors compiled this article, from planning and writing to content development, analysis, editing, and finalising the manuscript, without using Generative Artificial Intelligence (Generative AI) or AI-assisted technology.
Conflict of interest
The authors have declared no conflict of interest.
References
- Abd El-Galil K, Selim S, El-Kholy MS, Hassan RA, Mohamed MA, El-Sabrout K (2023). Effects of housing systems and feed additives on growth, carcass traits, liver function, oxidative status, thyroid function, and immune parameters of broilers. Poult. Sci., 102(12):103121.
- Adriani L, Abun, Mushawwir A (2015). Effect of dietary supplementation of Jengkol (Pithecellobium jiringa) skin extract on broiler chicken’s blood biochemistry and gut flora. Int. J. Poult. Sci., 14: 407- 410.
- Adriani L, Mushawwir A (2020). Correlation between blood parameters, physiological and liver gene expression levels in native laying hens under heat stress. IOP Conf. Ser. Earth Environ. Sci., 466: 012015. [CrossRef]
- Aritonang HN, Adriani L, Mushawwir A (2025). Effect of moringa leaves (Moringa oleifera) oil microcapsules (MOM) on growth and plasma metabolites related to inflammation in sentul chickens. Adv. Anim. Vet. Sci., 13: 835–842. [CrossRef]
- Aritonang HN, Mushawwir A, Adriani L, Puspitasari T (2024). Lipid regulation by early administration of irradiated chitosan and glutathione in heat-stressed broilers. IOP Conf. Ser. Earth Environ. Sci., 1292(1): 012011. [CrossRef]
- Aritonang HN, Mushawwir A, Susanti IS, Dityana AM (2026). Effects of a multi-component feed additive on performance and physiology of heat-stressed laying ducks reared without water play. Adv. Anim. Vet. Sci., 14(3): 480–488. [CrossRef]
- Cheng Y, Liu S, Wang F, Wang T, Yin L, Chen J, Fu C (2024). Effects of dietary Terminalia chebula extract on growth performance, immune function, antioxidant capacity, and intestinal health of broilers. Animals, 14(5): 746. [CrossRef]
- Dudi D, Hilmia N, Khaerunnisa I, Mushawwir A (2023). DGAT1 gene polymorphism and its association with fat deposition and carcass quality in Pasundan cattle of Indonesia. Biodiversity. 24: 4202-4208.
- Firmansyah A, Adriani L, Mushawwir A, Mayasari N, Rusmana D, Ishmayana S (2024). Effect of feed supplementation with liquid and powdered probiotic yogurt on the lipid profile of chicken egg yolk. Adv. Animat. Vet. Sci., 12(7): 1371-1377. [CrossRef]
- Heo YJ, Park J, Kim YB, Lee KW (2023). Effects of dietary protein levels on performance, nitrogen excretion, and odour emissions of growing pullets and laying hens. Poult. Sci., 102(8): 102798.
- Kamil KA, Latipudin D, Mushawwir A, Rahmat D, Balia RL (2020). The effects of ginger volatile oil (GVO) on the metabolic profile of the glycolytic pathway, free radical and antioxidant activities of heat-stressed Cihateup duck. Int. J. Adv. Sci. Eng. Inf. Technol., 10(3): 1228–1233.
- Kharazi AY, Latipudin D, Suwarno N, Puspitasari T, Nuryanthi N, Mushawwir A (2022). Lipogenesis in Sentul chickens during the starter phase inhibited by irradiated chitosan. IAP Conf. Proc., 1001(1): 1-7.
- Kwon BY, Lee HG, Jeon YS, Song JY, Kim SH, Kim DW, Kim CH, Lee KW (2024). Research Note: Welfare and stress responses of broiler chickens raised in conventional and animal welfare-certified broiler farms. Poult. Sci., 103(3): 103402. [CrossRef]
- Lee WD, Kim HJ, Kim H, Hong EC, Kim CH, Kang HK, Byun SJ, Son J (2024). Dietary energy levels affect productivity, meat quality, blood variables, energy efficiency and welfare indicators in broilers under welfare rearing conditions. Ital. J. Anim. Sci., 23(1): 1325-1335. [CrossRef]
- Liu S, Xiao G, Wang Q, Tian J, Feng X, Zhang Q, Gong L (2023a). Effects of dietary Astragalus membranaceus and Codonopsis pilosula extracts on growth performance, antioxidant capacity, immune status, and intestinal health in broilers. Front. Vet. Sci., 10: 1302801. [CrossRef]
- Liu M, Zhou J, Li Y, Ding Y, Lian J, Dong Q (2023b). Effects of dietary polyherbal mixtures on growth performance, antioxidant capacity, immune function and jejunal health of yellow-feathered broilers. Poult. Sci., 102(7): 102714. [CrossRef]
- Liu S, Wang K, Lin S, Zhang Z, Cheng M, Hu S, Hu H, Xiang J, Chen F, Li G, Si H (2023c). Comparison of the effects of tannins extracted from different natural plants on growth performance, antioxidant capacity, immunity, and intestinal flora of broiler chickens. Antioxidants, 12(2): 441.
- Luo Y, Bi Y, Xu Z, Shan L, He J, Wang K, Zhou Z, Yu L, Jiang X, Yang J, Yu L, Gao R, Wei J, Du X, Liu Y, Fang C (2024). Exploring possible benefits of Litsea cubeba Pers. Extract on growth, meat quality, and gut flora in white-feather broilers. Front. Vet. Sci., 10: 1335208. [CrossRef]
- Manin F, Yusrizal M, Adriani L, Mushawwir A (2024). Effects of the combination of probiotics fmand phytobiotics on broiler meat’s performance, gut dysbiosis, and lipid profile. Adv. Anim. Vet. Sci., 12(11): 2110-2117.
- Muhammad LN, Purwanti S, Pakiding W, Marhamah, Nurhayu, Prahesti KI, Sirajuddin SN, Mushawwir A (2023). Effect of combination of Indigofera zollingeriana, black soldier fly larvae, and turmeric on performance and histomorphological characteristics of native chicken at starter phase. J. Anim. Feed Res., 13(4): 279-285.
- Murtini S, Gunawan A, Khaerunnisa I, Lestari D, Fastawa R, Anggraeni A, Kim YS, Sumantri C (2025). Effects of maternal antibodies against myostatin on post-hatch chicken growth and muscle mass in Sentul Indonesian indigenous chicken. Vet. World, 18(2): 388-396. [CrossRef]
- Mushawwir A, Adriani L, Permana R, Sahara E (2025a). Egg production and physiological assessment of Sentul hens in temperate and lowland regions of West Java, Indonesia. Adv. Anim. Vet. Sci., 13(2): 413–420. [CrossRef]
- Mushawwir A, Permana R, Arifin J, Ali N, Sahara E (2025b). Impact of a low-calorie ratio supplemented with several amino acids for local chickens on ileum histological profile and growth. Adv. Anim. Vet. Sci., 13(4): 791–797.
- Mushawwir A, Permana R, Darwis D, Puspitasari T (2024). The ileal villi growth of native quail fed irradiated chitosan with glutathione from an early age at high temperature. IOP Conf. Ser. Earth Environ. Sci., 1292(1): 1-6.
- Mushawwir A, Permana R, Latipudin D, Suwarno N (2023). Flavonoids avoid damage to ileal plaque patches in heat-stressed Cihateup ducks. AIP Conf. Proc., 2628: 140007.
- Purwanti S, Pakiding W, Nadir M, Nurhayu, Prahesti KI, Sirajuddin SN, Syamsu JA, Mushawwir A (2024). Lipid regulation and cardiovascular biomarkers of native chickens fed a combination of maggot, Indigofera, and Turmeric. J. Anim. Health Prod., 12(2): 173- 181. [CrossRef]
- Rahmania H, Permana R, Latipudin D, Suwarno N, Puspitasari T, Nuryanthi N, Mushawwir A (2022). Enhancement of the liver status of Sentul chickens from the starter phase induced by irradiated chitosan. IAP Conf. Proc., 1001: 1-7. [CrossRef]
- Rusmana D, Aritonang HN, Sahara E, Alam ZF, Mushawwir A (2026). Integrated poultry energy index (ipei): Toward precision energy nutrition in Indonesian native chickens. Adv. Anim. Vet. Sci., 14(10): 2242-2249. [CrossRef]
- Son J, Lee WD, Kim CH, Kim H, Hong EC, Kim HJ (2024). Effect of dietary crude protein reduction levels on performance, nutrient digestibility, nitrogen utilisation, blood parameters, meat quality, and welfare index of broilers in welfare-friendly environments. Animals, 14(21): 3131.
- Tanuwiria UH, Mushawwir A, Zain M, Despal D (2023). Lipid regulation and growth on native ram lambs in the south coast of West Java, Indonesia fed legume forages. Biodiversity, 24(7): 4183–4192.
- Urban J, Kareem KY, Matuszewski A, Bien D, Ciborowska P, Lutostanski K, Michalczuk M (2025). Enhancing broiler chicken health and performance: the impact of phytobiotics on growth, gut microbiota, antioxidants, and immunity. Phytochem. Rev., 24(2):2131-2145. [CrossRef]
- Wlazlak S, Pietrzak E, Biesek J, Dunislawska A (2023). Modulation of the immune system of chickens: a key factor in maintaining poultry production: A review. Poult. Sci., 102(8): 102785. [CrossRef]
- Zhang Y, Fu X, Wang L, Guo X, Dong B (2024). Sorption of phenols and flavonoids on activated charcoal improves protein metabolism, antioxidant status, immunity, and intestinal morphology in broilers. Front. Vet. Sci., 10: 1327455. [CrossRef]
- Zhao W, Chen Y, Tian Y, Wang Y, Du J, Ye X, Lu L, Sun C (2023). Dietary supplementation with Dendrobium officinale leaves improves growth, antioxidant status, immune function, and gut health in broilers. Front. Microbiol., 14: 1255894. [CrossRef]
- Zhong Y, Li L, Chen W, Xing D, Wu X (2023). Effects of Ilicis chinensis folium extract supplementation on growth performance, serum parameters, intestinal morphology, and antioxidant capacity of broiler chickens. BMC Vet. Res., 19: 94. [CrossRef]
- Zhou X, Li S, Jiang Y, Deng J, Yang C, Kang L (2023). Use of fermented Chinese medicine residues as a feed additive and effects on growth performance, meat quality, and intestinal health of broilers. Front. Vet. Sci., 10: 1157935. [CrossRef]

Services
Article usage statistics
Loading…
Related articles
- Effect of Dietary Selenium Conjugated Protein Black Soldier Fly Larvae Meal on Carcass Characteristics and Meat Fatty Acid Profiles in Broiler DuckAdvances in Animal and Veterinary Sciences · 2024
- Effect of Dietary Protein: Energy Ratios on Nutrient Digestibility in Labeo rohita FingerlingsPakistan Journal of Zoology · 2021
- Natural and Biological Dietary Herbal Extracts Supplement on Productive and Physiological Parameters, Cecal Fermentation, and Meat Characteristics of Growing RabbitsAdvances in Animal and Veterinary Sciences · 2023
- Effect of Dietary Source of Omega-3 Fatty Acids on Milk Production, Fatty Acid Profiles and IGF-1 of Lactating Dairy Cows in Arid SubtropicsPakistan Journal of Zoology · 2024
- Optimizing Growth Performance in New Zealand White Rabbits: The Effects of Varying Energy and Protein LevelsPunjab University Journal of Zoology · 2026
- Consumption, Digestibility and Milk Production in Dairy Cows Feeding Different Energy and Protein RationsAdvances in Animal and Veterinary Sciences · 2025