
Nutritional interventions may reduce ruminant methane, but the evidence generated in Vietnam has not been brought together in a form that distinguishes the number of publications from the amount of independent experimental evidence. We reviewed four electronic sources and identified 24 reports describing 22 groups of related studies and 33 experiments. Eleven experiments provided data for numerical treatment comparisons. We checked whether these comparisons represented independent animals or donor samples and whether the statistical information needed to combine them was available. Seventeen in vivo methane-yield comparisons, expressed as treatment/comparator response ratios (RR), came from seven experiments in five study families; reuse of animals between the two S129 experiments was not reported. All RR values were below 1 (0.383–0.974), describing lower observed methane per unit feed intake without establishing statistical significance. This consistent direction identifies candidates for further testing, but does not establish a common reduction across interventions or production systems. We deliberately withheld a pooled national estimate because limited biological replication, unresolved dependence and differing interventions made its precision and interpretation unreliable. In vitro, one experiment used several vessels from a single pooled inoculum, which represented technical replication. Only two additional study groups included independent biological donors. These results are reported by study rather than combined. The evidence map identifies promising local research directions and major gaps in replication, reporting and geographic coverage. Confirmatory animal trials should jointly measure methane, feed intake and animal productivity.
Review · Volume 14, Issue 12, Pages 2843–2861, 11 November 2026 · Open Access
Vietnamese Ruminant Methane Responses to Nutritional Interventions: A Systematic Evidence Map and Quantitative Evidence Audit
· · · · ·
Affiliations & Notes ⌄
- 1Faculty of Animal Sciences, College of Agriculture, Can Tho University, Can Tho, Vietnam
- *Correspondence | Ho Thieu Khoi; Email: htkhoi@ctu.edu.vn
Article Info ⌄
- Journal:
- Advances in Animal and Veterinary Sciences
- Submitted Date:
- 18 August 2026
- Accepted Date:
- 20 October 2026
- Published Date:
- 11 November 2026
Abstract
INTRODUCTION
Reducing enteric methane is relevant to livestock climate mitigation, but feeding strategies must also preserve animal productivity. Methane forms during rumen fermentation, and interventions may reduce its formation, redirect hydrogen use or change the amount of methane produced per unit feed or animal product. International evidence supports several nutritional strategies, while showing that their effects vary with diet, animal species and implementation context ; . Vietnam has also included agricultural mitigation in its climate commitments (Socialist Republic of .
Dietary lipids can alter fermentation and inhibit methane-producing microorganisms, but responses depend on source, dose and basal diet. Reduced fibre digestion can offset the benefit . Tannins differ in chemistry and biological activity; source and concentration affect both methane and nutrient utilization . A review of tropical tannin-rich plants likewise found variable methane-reducing responses . Nitrate, forage replacement and biochar address different mechanisms and should be evaluated as distinct interventions.
Vietnamese experiments include feed resources that differ from many temperate feeding systems. Rice-straw-based substrates, for example, present a different fermentation background from highly digestible conserved-forage diets (Dinh Van Dung et al., 2024b). Catfish oil is another locally studied resource, whose response cannot be assumed to match a different dietary fat source . The included studies also cover tropical browse, crop byproducts and cattle, goat and sheep systems. Their relevance must be assessed alongside intake, digestibility and productivity, rather than inferred from international average effects alone. Practical relevance also depends on the comparator: changing a forage source answers a different question from adding an oil to the same diet. These distinctions matter when selecting candidates for local confirmatory trials and when interpreting apparent agreement in methane responses.
The evidence is difficult to combine because methane is reported as concentration, daily production, yield per unit dry-matter intake or model-derived output. Repeated use of animals, shared comparator groups and multiple publications from one project can inflate apparent replication. In vitro vessels prepared from one pooled inoculum measure responses within that batch rather than independently representing donors. In this review, a lower-methane pattern means an observed treatment/comparator point estimate below 1 for a specified methane outcome; it does not necessarily indicate statistical significance, causation or proven animal-level mitigation.
We therefore reviewed nutritional interventions tested in Vietnam to map reports, related study families and experiments; describe populations, interventions and methane measurements, assess risk of bias; reconstruct numerical comparisons, and evaluate whether pooling was justified. In vivo, in vitro, model-derived and active-comparator evidence were kept separate. The contribution is an auditable account of both the breadth of the experimental literature and the smaller amount of independent evidence available for quantitative inference.
MATERIALS AND METHODS
Review design and reporting framework
This systematic review and quantitative evidence audit evaluated nutritional strategies tested in ruminant experiments conducted in Vietnam. PRISMA 2020 guided reporting . Stable identifiers distinguished publications (REPORT_ID), related studies from one project (STUDY_ID), experiments (EXPERIMENT_ID) and numerical comparisons (EFFECT_ID). The evidence workbook was locked on 12 August 2026; a later dependence audit changed the synthesis from exploratory pooling to descriptive reporting. The revision retains the locked evidence set and the previously added S028 product-intensity example. It adds an experiment-specific disposition audit and targeted source checks of intake, digestibility and growth; these checks do not release new methane effects. The review was not prospectively registered. The versioned data and code package records the locked dataset, subsequent synthesis changes and descriptive R executions; it is not a prospectively registered protocol.
Eligibility criteria
Reports were eligible if they described original In vivo ruminant or in vitro rumen experiments explicitly conducted in Vietnam, tested a nutritional intervention or feeding comparison, and reported a methane outcome. Eligibility depended on the experimental site rather than author affiliation or animal breed. Journal articles, proceedings, theses and accessible preprints were eligible when their methods and results permitted verification. An untreated arm was not mandatory for the evidence map: diet comparisons, active comparators and matched factorial contrasts could answer different questions. The comparator was retained as reported and was never relabelled as untreated.
Eleven of the 24 reports, representing nine study families and 13 experiments, lacked one untreated comparator applicable to the whole design. These families were S011, S013, S016, S023, S026, S028, S035, S041 and S045; S016 contributed three reports but one family. Some experiments instead compared active diets or included a zero level within one factor. These comparisons remain eligible, but answer their specific dietary questions rather than a common treatment versus-untreated question. Supplementary Table S20 documents the comparators. Removing these families was a sensitivity check of map coverage, not an alternative efficacy analysis.
Reports were excluded at full text when the experiment was conducted outside Vietnam; used an unsuitable species or rumen model; lacked an eligible nutritional intervention/comparison; lacked a methane outcome; lacked a usable comparison for the intended evidence pathway; was not original research; duplicated a companion or container report without adding synthesis data; or remained insufficient to confirm eligibility after reasonable review. Each assessed full text received one primary exclusion reason. Reports that could not be retrieved were counted separately and were not assigned a full-text exclusion reason.
Information sources and search strategy
The archived record set has four reported source origins: Google Scholar, PubMed/MEDLINE via PubMed, ProQuest Central and Springer Nature Link. The RAW Zotero archive contains 215 records: 73 attributed to Google Scholar, 34 to PubMed, 48 to ProQuest and 60 to Springer. These are saved-record counts rather than database hit totals. Nine source tags occur on 203 records; the Google Scholar origin of the 12 untagged records was confirmed retrospectively by the authors. The later 135-record Zotero CSV records additions on 8–10 August 2026. These addition dates are reported separately from browser-access dates because they cannot establish the execution date of each main search.
In retrospective clarification, the authors described the main searches as separate entries of individual terms or phrases about ruminants and rumen systems; methane and related outcomes; Vietnam or Viet Nam; and nutritional or feed interventions in focused supplementary searches, without explicit Boolean combinations. They reported screening the first three Google Scholar result pages and conducting no backward reference-list or forward citation searching. On 13 October 2026, they clarified that the Boolean expressions and deeper Google Scholar pagination observed in browser history were trial searches rather than the main search procedure. This explanation distinguishes the reported main procedure from exploratory browser activity; it does not independently recover the exact main-search strings, final settings or query-to-record links.
Recovered browser evidence includes 45 Google Scholar, six PubMed and three Springer query strings, with observed access on 7–12, 15 and 17 August 2026; 6, 8 and 9 August; and 9 August, respectively. The appendix preserves strings, dates and settings, including trials and title lookups, without treating them as verified main searches. These are access dates, not independently verified query-execution dates. Browser visits alone do not verify successful retrieval, record export, screening or the final included evidence. On 16 October 2026, the corresponding author confirmed ProQuest access through the Can Tho University Library portal, currently listing ProQuest Central. Historical ProQuest queries, selected collections, filters and execution dates could not be recovered. Ancillary ScienceDirect/CABI visits add no records to the locked PRISMA flow.
Supplementary Methods S1 and Table S28 distinguish the reported main procedure from recovered historical browser activity. The sanitized query inventory accompanies the data package. The historical audit did not add records to the locked evidence set.
Record management and study selection
Search records were consolidated in Zotero and duplicates were merged before screening. Two saved ScienceDirect search-result pages were removed as non-bibliographic items. Ho Thieu Khoi and Vo Hoang Nam Phuong independently conducted title/abstract screening and full-text assessment. Disagreements were discussed jointly to reach a consensus decision. Six AI/computer-vision records were part of the initial screening set; their presence does not change the locked identification count. Vo Hoang Nam Phuong extracted the data, and Ho Thieu Khoi assessed experiment-level risk of bias. Extraction and risk-of-bias assessment were performed by one person each, rather than independently in duplicate. Disagreements arising during review were resolved through joint discussion and consensus. Structured and AI-assisted tools supported evidence organization; human assessors made the eligibility, extraction and risk-of-bias decisions. The PRISMA flow was generated from the locked count ledger.
Study-family and experiment mapping
Eligible reports were linked as report → study family → experiment to prevent biological double counting. A shared institution or author alone was insufficient for grouping. Linkage required convergent evidence about the project, experimental site, time window, animals or age strata, and intervention/design structure. R016, R020 and R029 shared the Hanh Cuong farm project in An Giang and the maize/cassava × Tra fish-oil comparisons. R016 summarized age strata; R029 matched the 17–20-month stratum and R020 matched the 21–24-month stratum, including the reported 2024 project period. The ledger records these as S016, retaining the most informative report for each experiment and using companion reports for verification. Supplementary Table S21 gives the linkage evidence; it does not claim that individual animal identities were independently recovered.
Companion/container exclusion in the PRISMA flow applied to an assessed full text that added no eligible original data. This differed from retaining several informative reports within one study family: All three S016 reports remained included, while their overlapping experiments were counted once. The 24 reports therefore represented 22 study families and 33 experiments.
Study families were mapped rather than individual effects. Ho Thieu Khoi extracted study-site names and addresses from the materials and methods sections of the original reports. Reported sites were represented by seven approximate geographic reference points at city, province, regional or institutional level, listed in Supplementary Table S17. Named farms remain in the reported-site descriptions but are mapped to their broader locality; Ba Vi and Gia Lam share the Hanoi reference. S016 uses its dominant An Giang site while retaining the linked Can Tho laboratory context. S023 uses a broad Southwestern Vietnam reference, and S032 uses a flagged Nong Lam University institutional proxy because the farm province was not established. The R script reads the stored coordinates and applies small deterministic offsets to separate coincident markers. The corresponding author obtained the numerical latitude–longitude coordinates from Google Maps. The map therefore describes broad geographic research coverage; its points are not measured trial GPS positions.
Data extraction and evidence profiling
Vo Hoang Nam Phuong extracted data by arm, outcome and time point. Fields covered identifiers; year and site; model, species and breed; intervention and dose basis; comparator; methane metric and method; means, dispersion and sample size; biological and technical units; donor, vessel and run structure; source location; and dependence. Doses reported by authors were kept separate from standardized or calculated values. Missing fields were coded NR and inapplicable fields N/A. Methane yield meant methane per unit dry-matter intake, product intensity meant methane per unit live-weight gain or milk output. These metrics were not treated as interchangeable.
Extraction and quantitative use were separated. Missing means, dispersions, sample sizes or correlations were not silently imputed. The 47 released effect records comprised 40 using reported SEM, three using reported SE and four whose SD values were converted to SE as SD/√n with n = 4 animals. The four conversions were EFF013–EFF016 from S059; only EFF013 and EFF015 entered the 17-record primary methane-yield display, while EFF014 and EFF016 were alternative records. No SEM-to-SD conversion was performed in that effect-construction workflow. Counts refer to effect records, which can share arm data; they are not counts of independent samples. Supplementary Table S24 records each conversion. The separately rechecked S028 product-intensity table remains descriptive. V14 adds targeted, source-linked examples of intake, digestibility and growth from included reports, listed in Supplementary Table S29. These examples do not constitute a complete co-outcome inventory or a pooled productivity synthesis; missing values were not imputed.
Outcome hierarchy and quantitative evidence pathways
In vivo, in vitro, model-derived and secondary factorial evidence were separate pathways. Seventeen directly measured In vivo CH₄/DMI comparisons were selected from seven experiments in five study families. S129-E01 and S129-E02 were separate Latin-square experiments, but the report did not identify whether goats were reused between them; neither shared animals nor independent cohorts were assumed. Their identifiers and selection roles are provided in Supplementary Table S22. Other methane outcomes, alternative S059 records and active-arm S028 comparisons were not additional primary yield comparisons. Complete repeated-animal cross-effect covariance was unavailable in the published-data audit for S014, S128, S059 and S129. S036 allowed shared-control covariance reconstruction, but represented one independent experiment. These limitations and the differing interventions motivated descriptive reporting rather than a common national effect.
S027 used five vessels per treatment/time prepared from one pooled inoculum/batch. Its 48-h and 24-h dose contrasts describe that batch and are retained as technical replication. S053-E02 and S132-E02 each retained four separate biological donors. These are two independent donor-based study clusters; responses were therefore displayed by study without a pooled in vitro estimate. S028 provided matched tannin contrasts within two active oil levels. Its full 2 × 2 design can in principle support an oil × tannin interaction; the absence of a zero-treatment arm restricts the question to incremental active-arm effects, not the validity of factorial analysis itself.
Mean variance–n–unit dependence verification
Before an EFFECT_ID was released, each candidate contrast was checked for source-verified treatment/comparator means, dispersion type, variance-bearing n, experimental unit and known dependence. The final dependence re-audit added a stricter synthesis gate: effect reconstruction alone did not establish eligibility for pooled inference. Where the biological unit was technical (S027) or the required cross-effect covariance was not recoverable (several repeated-animal/Latin-square clusters), effect records were retained as descriptive quantitative evidence rather than treated as independent contributions to a meta-analytic mean.
The quantitative subset was not a second eligibility screen: all 33 experiments remain in the evidence map. The locked mean–variance–n–unit–dependence pathway determined which contrasts were released, but its incomplete verification for some otherwise promising candidate rows limits the completeness of the descriptive quantitative audit. The documented release criteria did not include result direction. However, the available records do not establish that completion of verification was unrelated to study results. No additional effect estimates were retrospectively released in this revision.
Risk-of-bias assessment
Ho Thieu Khoi assessed risk of bias per experiment using a review-specific adaptation of SYRCLE concepts , with eight domains: Sequence generation, allocation concealment, unit independence/baseline balance, carryover/period, measurement, missing data, selective reporting and other bias. Ratings were Low, Some concerns, High or Not applicable. Low required source-supported protection against the specified bias; unreported safeguards led to Some concerns, and High required an identified material bias mechanism. The carryover/period domain applied to crossover, Latin-square or repeated-period designs: Low required adequate sequence/period handling and justified adaptation; Some concerns indicated insufficient reporting; fixed treatment-before/after sequences confounded with time were High. Overall High required a critical High domain; otherwise any applicable concern led to Some concerns. The operational criteria and source-linked overall drivers are in Supplementary Table S23. During the preceding revision, the authors reviewed and approved the operational criteria and judgments in Supplementary Table S23; disagreements were resolved through joint discussion and consensus. This was not an independent duplicate assessment. Ratings qualified interpretation and were not numerical weights.
The original SYRCLE tool addresses animal intervention studies using ten entries and Low, High or Unclear judgments . Our eight-domain framework and the label Some concerns are review-specific adaptations, not the original tool or a validated instrument for in vitro efficacy. For in vitro experiments, sequence generation concerned assignment of treatments to incubation units; unit independence concerned separate donors and runs, rather than vessel counts alone; and measurement and missing-data judgments concerned the assay and completeness of treatment/time-point records. Allocation concealment was marked not applicable where fixed laboratory allocation made it irrelevant. Period/run confounding remained applicable to sequential laboratory runs, including S035-E01, without implying physiological carryover. These adaptations make the biological unit explicit but limit comparability with reviews using unmodified SYRCLE. Their judgments are descriptive and are not numerical study weights.
Certainty of evidence
A retrospective GRADE-adapted evidence profile was prepared separately for intervention–comparator questions within the In vivo and donor-replicated in vitro streams, rather than for a pooled national effect . Risk of bias, inconsistency, indirectness, imprecision and publication bias were considered even without meta-analysis. Single-cluster comparisons were not automatically downgraded for inconsistency; their lack of independent replication and unresolved uncertainty informed imprecision. Unavailable prospective protocols indicated possible selective reporting rather than proof of suppressed results. The profiles in Supplementary Table S25 rate the relevant comparison-level evidence as very low certainty, mainly because of risk of bias and very serious imprecision. S027 was not assigned biological efficacy certainty because one pooled batch supplies no independent donor replication. The comparison definitions and domain judgments in Supplementary Table S25 were reviewed and approved by the authors during the preceding revision. No new ratings were assigned for V14. This was a retrospective assessment.
Statistical analysis
Effect-size calculation: The response ratio (RR) expresses proportional change in a positive methane outcome and is readily interpreted across compatible measurement units. We chose it over a standardized mean difference because the latter divides by a study-specific SD, which can obscure proportional methane reduction. A raw mean difference remains useful within one common unit but is not comparable across different methane metrics. RR did not make yield, concentration and product intensity the same outcome. For comparison i:
RRi = MT,i / MC,i ….(1)
M_T,i is the treatment-arm mean and M_C,i is the matched comparator-arm mean for the same outcome, unit and time point. RR < 1 indicates lower methane, RR = 1 no relative change and RR > 1 higher methane. The natural logarithm y_i is the effect-size representation of RR used in the archived variance calculations:
yi = ln(RRi) = ln(MT,i / MC,i) …(2)
RR values were recovered from y_i using exp(y_i). Percentage change for the same contrast was:
Percentage changei = 100 × (RRi − 1) …(3)
Thus negative percentage change denotes lower methane for that contrast. For example, RR = 0.80 corresponds to −20%. Equations 2 and 3 describe the log response ratio and percentage change, respectively. The primary In vivo target was CH₄/DMI; product-intensity comparisons were a separate descriptive extension.
Dependence re-audit and synthesis rule
The published-data audit checked arm means, dispersion type, variance-bearing sample size, shared arms, animal/donor identity, repeated periods and reported model-error information. A matrix of sampling covariances records correlations among estimates that reuse those units. Exact shared-control entries could be calculated for S036. The full repeated-animal blocks for S014, S128, S059 and S129 were not identified by the available published summaries. The archive explored assumed correlations of 0.25, 0.50 and 0.75; these are sensitivity assumptions, not recovered data. No original study authors were contacted to request additional data or covariance information. Accordingly, non-recovery refers to the available published records, not to an unsuccessful author-contact attempt. Author-assisted recovery of missing covariance was therefore not evaluated.
Archived exploratory models used CR2 cluster-robust standard errors and Satterthwaite degrees of freedom to account for dependent estimates and small cluster counts . Robust inference can be used with an approximate working covariance; missing covariance does not by itself make every meta-analysis invalid. The in vivo records came from seven experiments in five study families, with uncertain animal identity across the two S129 experiments; no fixed independent-cluster count was assigned to that family. Only two donor-based in vitro study clusters were available. Differing intervention questions and unresolved design dependencies further limited synthesis. A national combined estimate would therefore be fragile and difficult to interpret. We retained study-wise point estimates and did not use archived pooled models, P values or prediction intervals as final findings.
Descriptive quantitative summaries
Means were divided by their matched comparator means and displayed on the RR scale by family and experiment. The primary display contains the 17 locked direct CH₄/DMI records, with S059 alternative outcome records kept separate. No pooled mean, pooled P value, heterogeneity statistic or prediction interval is presented as a final result. S028 methane-yield and product-intensity contrasts show the increment from 0.3% to 0.5% tannin within each oil level. Their opposed point-estimate directions do not constitute a formal interaction test; the complete source model and covariance information would be required to report an appropriate uncertainty estimate. The previously displayed S028 normal-approximation confidence intervals have been removed from final descriptive reporting and retained only in the archive.
Assessment of small-study effects
Funnel-plot asymmetry tests, Egger-type regression, trim-and-fill procedures and meta-regression were not performed because the evidence contained too few independent biological clusters and no final pooled meta-analysis was retained.
Software and statistical conventions
The earlier exploratory analyses used R 4.4.3, metafor 5.0-1 and clubSandwich 0.7.0. The descriptive revision workflow was executed on 3 October 2026, and the V13.1 figure corrections were executed on 4 October 2026 using R 4.4.3 under Windows 11, with ggplot2 4.0.3, patchwork 1.3.2, maps 3.4.3 and ggrepel 0.9.8. The execution logs and session information accompany the reproducibility package. All 47 response ratios and the 17-record primary display were checked against the locked input; nine figures were exported as vector PDF and 600-dpi PNG/TIFF and visually reviewed. No new pooled meta-analysis or significance threshold was used. For V14, Figures 3 and 4 were redrawn with base R graphics from the same locked inputs. Their plotting script and verification ledger accompany the V14 addendum; this redraw did not fit a new inferential model.
Use of generative artificial intelligence
Generative artificial intelligence was used to support English-language editing, evidence organization and manuscript drafting. AI outputs were not treated as final eligibility, quantitative methane-extraction, risk-of-bias or scientific decisions. Eligibility decisions, methane values used in released effect records and the experiment-level risk-of-bias judgments were checked against source documents in the locked workflow. The V14 revision used AI-assisted checks of archived search evidence, bibliographic metadata and selected co-outcomes against local source reports. The new source-linked examples are identified in Supplementary Table S29 and do not constitute independent duplicate human extraction. No artificial-intelligence system was assigned authorship.
RESULTS
Study selection
The searches identified 215 records. After removal of 78 duplicates and two saved search-result pages, 135 records underwent title-and-abstract screening, of which 89 were excluded. Forty-six reports were sought for retrieval; three were unavailable, leaving 43 full-text reports for eligibility assessment. Nineteen full-text reports were excluded, resulting in 24 included reports representing 22 study families and 33 experiments (Figure 1). Eleven experiments contributed quantitative effect reconstruction; the remainder informed the systematic evidence map and narrative synthesis.
Characteristics of the included evidence
The evidence included 16 in vivo and 17 in vitro experiments; 21 involved cattle or cattle-rumen systems. Lipid/oil interventions were the largest intervention class. Twenty-four experiments included a direct methane assay: 11 in vivo and 13 in vitro. This assay category includes measured gas composition used with an emission calculation and should not be read as 24 direct whole-animal flux measurements. Four experiments used model-derived methane, and five linked contextual experiments had no methane assay. Table 1 summarizes these mutually exclusive experiment categories; Supplementary Tables S3, S13–S16 and S22 give methods, report links and quantitative disposition. The remaining included reports are documented in Supplementary Table S13 ; D. Mo and Nguyen Van Thu, 2025; Dinh Van Dung et al., 2024a; ; ; ; , 2019; , 2026; ; ; ; ; .
Of the 33 included experiments, 11 contributed the locked descriptive effect reconstruction. The other 22 comprised four experiments with model-derived methane, five linked contextual experiments without a methane assay, and 13 methane-assay experiments without released effect records. The original extraction workflow identifies specific numerical or design barriers for seven of these 13: factorial marginal means rather than treatment-cell means (S011-E01), unavailable dispersion in the extracted methane table (S013-E01 and S016-E01), one pen per treatment (S032-E01), figure-only numerical inputs that had not been extracted (S035-E01 and S125-E01), and factorial marginal means with unresolved independent n (S045-E01). For the remaining six (S014-E01, S026-E01, S033-E01, S037-E01, S041-E02 and S130-E01), some candidate rows had passed the earlier preliminary
Table 1: Characteristics and disposition of the included evidence base counts are experiment-level unless stated otherwise. Intervention groups are mutually exclusive primary programme labels; multi-component designs retain their individual factors in Supplementary Table S3. The four assay rows total 24 experiments (11 in vivo and 13 in vitro).
| Domain | Characteristic | n | Classification or interpretation |
| Evidence base | Reports | 24 | Eligible publications or accessible reports. |
| Evidence base | Study families | 22 | Companion reports grouped to prevent double counting; a family is not a count of independent treatment contrasts. |
| Evidence base | Experiments | 33 | Unit used for evidence mapping and risk-of-bias assessment; experiments within a family may be dependent. |
| Biological model | In vivo/ in vitro | 16 / 17 | Analysed in separate evidence pathways. |
| Species/system | Cattle/ goat/ sheep/ ruminant | 21/10/1/1 | Experiment-level species/system designation in the extraction. |
| Intervention | Lipid or oil, with or without tannin | 16 | Fish/catfish oil, coconut oil, oil-tannin combinations, CNSL and medium-chain fatty-acid programmes. |
| Intervention | Diet, forage or byproduct | 8 | Diet patterns, concentrate levels, byproduct supplementation and forage/silage replacement. |
| Intervention | Nitrate or non-protein nitrogen | 4 | Nitrate/NPN comparisons, including factorial combinations with tannin-rich foliage or processing. |
| Intervention | Biochar | 3 | Biochar source, processing or inclusion-level interventions. |
| Intervention | Tannin-rich forage | 2 | Mimosa pigra replacement in two Latin-square experiments; reuse of individual goats across experiments is unconfirmed. |
| Methane method | In vivo chamber or hood assay | 7 | Respiration/chamber, ventilated hood or head-cage methods with gas analysis. |
| Methane method | In vivo eructed-gas assay | 3 | Eructed-gas ratio or closed-chamber eructed-gas methods; not equivalent to continuous whole-animal flux measurement. |
| Methane method | In vivo automated spot sampling | 1 | Automated spot-sampling system. |
| Methane method | In vitro methane assay | 13 | Incubation gas analysis by chromatography, infrared/biogas/portable gas analysers, gas detectors or gas-production methods. |
| Methane evidence | Model-derived methane | 4 | All In vivo; calculated from prediction models and kept separate from assay-based evidence. |
| Methane evidence | No methane assay in companion experiment | 5 | One In vivo and four in vitro experiments provide contextual outcomes without an experiment-level methane assay. |
| Risk of bias | Some concerns/ high/low | 26 / 7 / 0 | Experiment-level overall judgment. |
| Quantitative role | Effect reconstruction/ evidence map only | 11 / 22 | Reconstruction does not imply independent contribution to a pooled meta-analysis. |
CNSL, cashew nut shell liquid; NPN, non-protein nitrogen. The assay classification includes gas composition used with an emission calculation and does not imply that all methods measure whole-animal methane flux directly. See Supplementary Tables S3, S15 and S22 for experiment-level accounting.
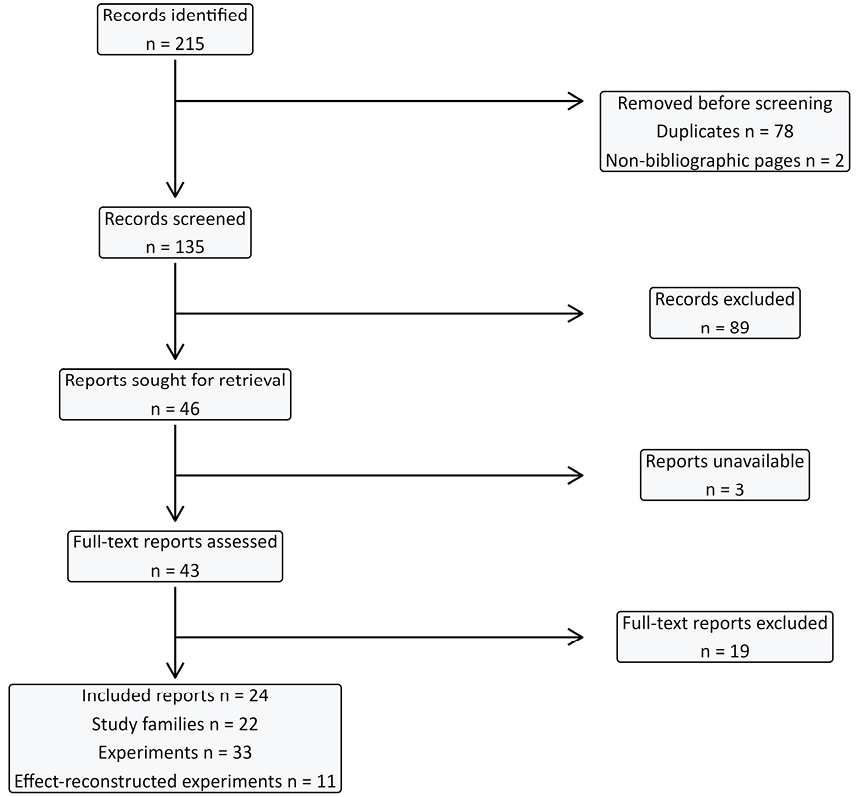
PRISMA 2020 flow diagram. Counts reconcile as 215 identified records − 78 duplicates − 2 non-bibliographic pages = 135 screened; 46 sought − 3 unavailable= 43 assessed; 43−19 excluded= 24 included reports. Informative companion reports remain included but are grouped into 22 study families. Eleven of 33 experiments contributed numerical effect reconstruction. This does not imply eligibility for inferential pooling.
quantitative checks, but source-level human verification and effect release were not completed in the locked workflow. S033-E01 and S041-E02 also had outcome-specific dispersion gaps. We therefore do not equate absence of a released effect with absence of numerical information. Supplementary Table S27 records the experiment-specific disposition. The quantitative subset reflects both data availability and completion of verification, and its observed directions and magnitudes may be affected by selective availability.
The 47-record audit ledger contains several methane outcomes and alternative records, so it is not a count of independent primary comparisons. Seven in vivo experiments produced the 17 primary CH₄/DMI records; S028-E01 supplied two secondary active-arm yield contrasts. Three in vitro experiments supplied 17 dose/time records. The V14 clarification changes the description of selection, not these locked numerical records.
Quantitative evidence after dependence re-audit
The 17 direct in vivo CH₄/DMI point estimates came from seven experiments in five study families: S014 (three comparisons), S128 (three), S059 (two), S129 (six) and S036 (three). All selected ratios were below 1 (RR 0.383–0.974), describing lower observed methane yield relative to the matched comparator. The 17 records are not 17 independent confirmations or 17 statistically significant effects. S014, S128 and S059 reused animals across treatments or periods. S129 repeated animals within each Latin square, but reuse between E01 and E02 was not reported; the two experiments are presented separately without assuming shared or independent animal cohorts. The three S036 contrasts share one comparator arm. Study-family panels are display groups, not an asserted count of independent clusters. The descriptive pattern does not establish a common effect, a national reduction or comparative efficacy. Figures 3 and 4 and Table 2 identify the experiments and known dependencies.
Table 2: Quantitative evidence disposition after dependence re audit. Primary in vivo methane yield: 17 comparisons from 7 experiments in 5 study families (first five display rows). Study-family grouping does not establish independent biological clusters. S129-E01 and E02 are separate Latin squares with unreported cross-experiment animal identity; neither shared animals nor independence is assumed.
| Evidence unit | Biological design or replication | Records | Dependence and uncertainty | Final role | Observed RR |
| S014 1 family |
4 x 4 Latin square; 4 animals | 3 | Same animals and shared comparator; within-animal covariance unreported. | Primary In vivo yield; descriptive | 0.904-0.974 |
| S128 1 family |
4 x 4 Latin square; 4 animals | 3 | Same animals and shared comparator; within-animal covariance unreported. | Primary In vivo yield; descriptive | 0.655-0.800 |
| S059 1 family |
Two runs; same 4 cattle across repeated periods | 2 | Cross-period and cross-run covariance unreported. | Primary In vivo yield; descriptive | 0.761-0.792 |
| S129 1 family |
Two Latin-square experiments; 4 goats per experiment | 6 | Repeated animals within each experiment; animal identity across E01/E02 not reported. No cross-experiment independence or shared-animal assumption. | Primary In vivo yield; descriptive | 0.749-0.961 |
| S036 1 family |
Parallel 4-arm trial; 16 goats (4 per arm) | 3 | Shared comparator; shared-control covariance reconstructable within this one cluster. | Primary In vivo yield; descriptive | 0.383-0.732 |
| S027 1 batch |
One pooled inoculum/batch; 5 vessels per treatment/time | 4 at 48 h; 4 at 24 h |
Technical vessels within one batch; not 5 independent biological replicates. | In vitro within batch description | 48 h: 0.845-0.904; 24 h: 0.765-0.892 |
| S053 1 family |
4 independent cow donors; donor-specific inocula | 5 | Repeated donor comparisons and shared comparator; donor correlation unreported. | In vitro donor based description | 0.806-0.981 |
| S132 1 family |
4 independent goat donors; donor-specific inocula | 4 | Repeated donor comparisons and shared comparator; donor correlation unreported. | In vitro donor based description | 0.726-1.015 |
| S028 1 family |
2 x 2 oil-by-tannin factorial; 24 cattle (6 per arm) | 2 | Matched active arms; source-model contrast uncertainty needed. | Secondary In vivo simple effects; descriptive | Yield: 0.887 and 1.074; no formal interaction test |
RR= treatment/comparator. Every RR is descriptive. No pooled effect, confidence interval, P value, inferential conclusion or intervention ranking is reported. Family rows group the evidence for display; they do not establish exchangeability of species, interventions, designs or measurement methods. S028 compares active factorial arms. A zero arm is not required to estimate factorial interaction, but a valid interaction test requires the source-model contrast and its uncertainty. Two product-intensity comparisons are reported separately in Supplementary Table S26.
This distinction is visible in the original reports: S014 reported an overall P value of 0.073 for CH₄/DMI, and the water-spinach experiment in S129 reported P = 0.45 for this outcome, although their selected treatment/comparator ratios were below 1 ; . These are source-reported omnibus tests, not review-derived contrast-specific tests, and they do not resolve the dependence limitations.
In vitro and factorial quantitative evidence
S027 had lower methane point estimates within its pooled batch at 48 h (RR 0.845–0.904) and 24 h (0.765–0.892). Five vessels per treatment/time measured technical variation within that batch, not five independent donor responses. These contrasts inform dose and time selection for replication in fresh biological batches. They do not establish reproducibility across donors, animal-level efficacy or significance in a biological population. S053 ranged from 0.806 to 0.981 and S132 from 0.726 to 1.015. Each retained four separate donors, but there were only two independent study clusters; their study-wise results were not pooled.
Multiple vessels can characterize analytical and fermentation variation within the prepared inoculum, but they do not create additional donor populations. Treating those vessels as independent biological replicates would inflate the nominal sample size and could underestimate uncertainty for a donor- or animal-level claim. Pooling fluid from several animals before incubation does not preserve separate donor responses. Consequently, S027 is informative about the tested inoculum and conditions, while donor-level reproducibility and animal-level performance remain unestablished.
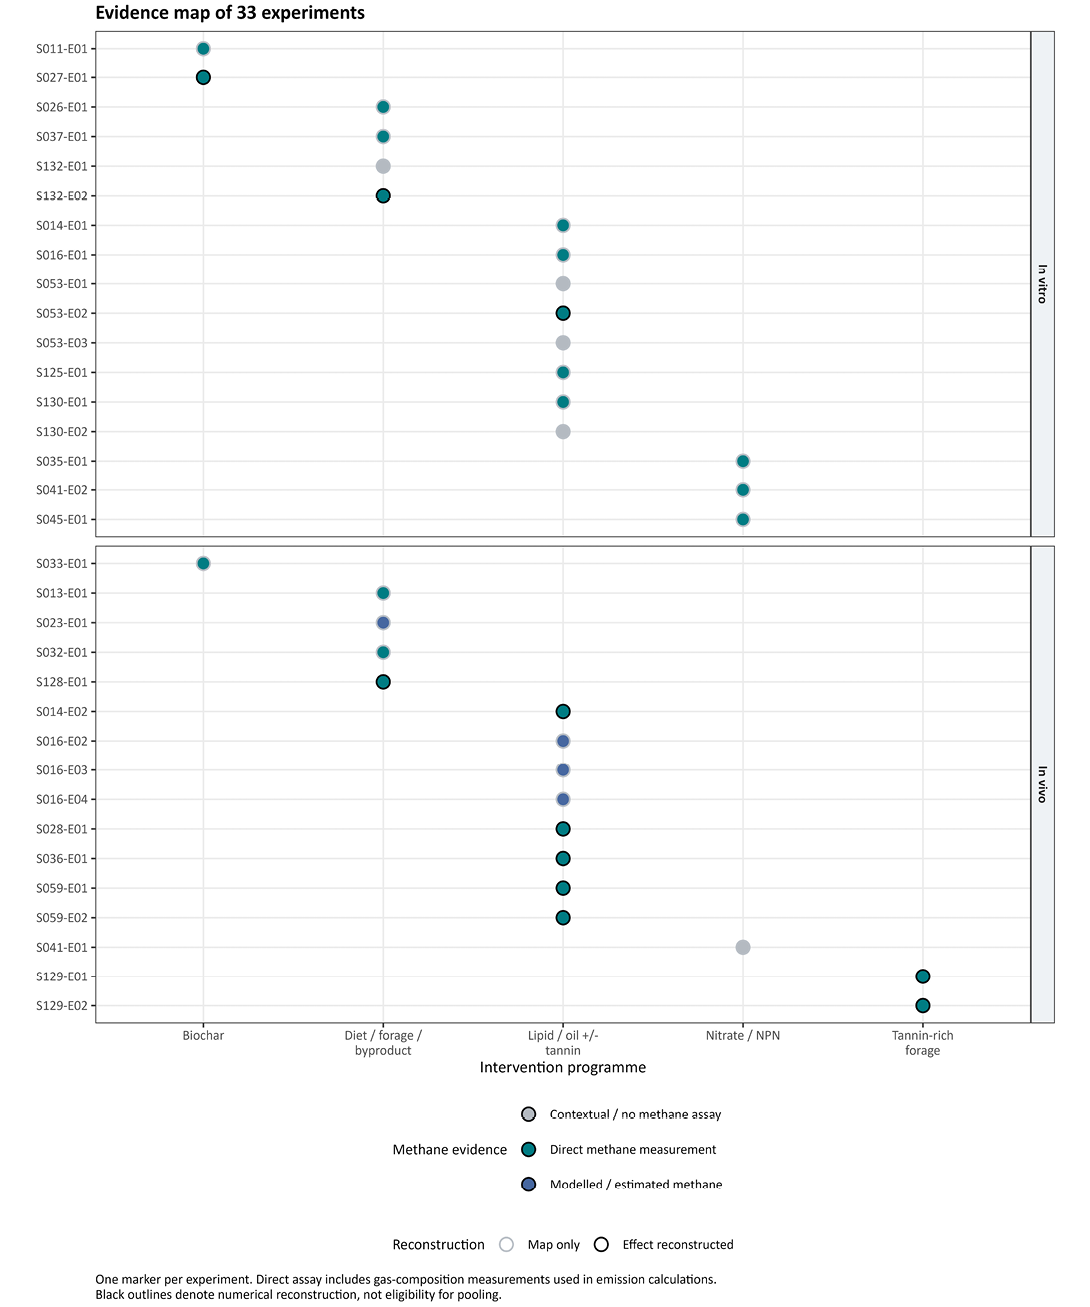
Evidence map of all 33 included experiments. Each marker represents one experiment, labelled by EXPERIMENT_ID. Colour distinguishes methane-assay, model-derived and contextual experiments without a methane assay. The assay category includes gas composition used in an emission calculation; it is not synonymous with direct whole-animal flux measurement. Black outlines identify the 11 experiments contributing numerical effect reconstruction, not eligibility for pooled inference.
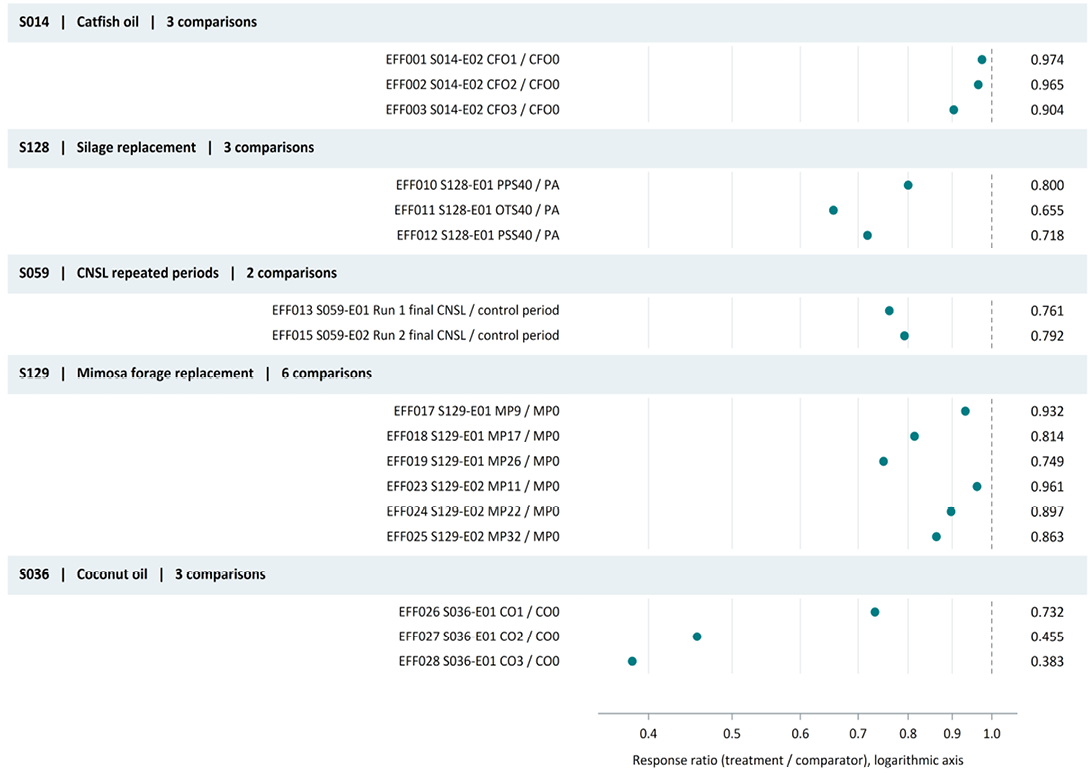
Direct In vivo methane-yield comparisons: 17 response-ratio records from seven experiments in five study families. Panels group records by study family for display and do not define independent biological clusters. S129-E01 and S129-E02 are separate Latin-square experiments; animal reuse between them is not reported, so neither shared animals nor independence across them is assumed. Repeated animals within experiments and shared comparators make multiple contrasts dependent. Response ratios are treatment/comparator on a logarithmic axis; the dashed line denotes RR = 1. No confidence intervals, inverse-variance weights, pooled estimate or inferential conclusion are presented.
S028 compared 0.5% with 0.3% tea-byproduct tannin at fixed cottonseed-oil levels. Methane-yield point estimates were lower at 1.5% oil (RR 0.887) and higher at 3.0% oil (RR 1.074). These are incremental active-arm comparisons. They do not estimate tannin supplementation versus an untreated diet, and opposed directions alone are not an interaction test.
Methane product intensity
Table 3 of the included S028 report gives methane intensity of 213.11, 187.33, 196.79 and 211.00 L CH₄/kg live-weight gain for O1.5T0.3, O1.5T0.5, O3.0T0.3 and O3.0T0.5, respectively (Chu Manh Thang and Tran Hiep, 2020). The reported common SEM was 4.91, with six cattle per arm. Within 1.5% oil, the higher-tannin/lower-tannin ratio was 0.879 (−12.1%); within 3.0% oil it was 1.072 (+7.2%). These descriptive ratios were calculated from source-reported intensity means, not from dividing methane means by unverified growth data. No new confidence intervals or P values were calculated. This is an illustrative extension from one included experiment, not an exhaustive product-intensity synthesis or a whole-farm carbon footprint (Supplementary Table S26).
Intake digestibility and animal productivity
Selected source reports illustrate why intake and productivity must accompany methane interpretation. In S014, reported DM intake was 4.89, 4.90, 4.89 and 4.83 kg across the zero to 3% catfish-oil diets; the source reported no detected difference in this outcome (P = 0.918), which does not establish equivalence . In S028, the four active oil–tannin diets had DMI of 8.39, 9.43, 9.49 and 8.68 kg/head/day and live-weight gain of 1225.66, 1411.16, 1388.32 and 1268.91 g/head/day in the order O1.5T0.3, O1.5T0.5, O3.0T0.3 and O3.0T0.5 . These contextual values accompany the product-intensity results from the same experiment.
Table 3: Study specific nutritional interventions observed methane responses and biological replication. Nine study families contribute the numerical records below. Within-experiment contrasts can share animals or comparators; all responses are descriptive.
| Intervention study family and source | Species and model | Observed methane response | Biological replication | Principal limitation |
| Catfish oil (S014) Nguyen Van Thu and Nguyen Thi Kim Dong (2021) |
Cattle, In vivo | CH4/DMI RR 0.904–0.974; 3 comparisons | 4 cattle in one 4×4 Latin square | Shared animals and comparator; within-animal covariance unavailable; observed direction is not a significance test. |
| Coconut oil (S036) Nguyen Thi Kim Dong and Nguyen Van Thu (2018) |
Goats, In vivo | CH4/DMI RR 0.383–0.732; 3 comparisons | 16 goats; 4 per arm in one parallel trial | Shared zero-oil comparator; one independent study cluster despite reconstructable shared-control covariance. |
| Cashew-nut-shell liquid (S059) Maeda et al. (2021) | Cattle, In vivo | CH4/DMI RR 0.761–0.792; 2 selected comparisons | Same 4 cattle across two runs | Control-before-treatment sequence is confounded with time; cross-period/run covariance unavailable. |
| Silage-source replacement (S128) Nguyen Van Thu (2020) | Sheep, In vivo | CH4/DMI RR 0.655–0.800; 3 comparisons | 4 sheep in one 4×4 Latin square | Reused sheep and reference diet; within-animal covariance unavailable; specific forage replacements. |
| Mimosa pigra forage replacement (S129) Nguyen Thi Thu Hong et al. (2021) | Goats, In vivo | CH4/DMI RR 0.749–0.961; 6 comparisons | 4 goats per experiment; two Latin squares | Two basal diets; animal/comparator reuse within each Latin square. Cross-experiment animal identity unreported; neither shared animals nor independence is assumed. |
| Rice-husk biochar (S027) Dinh Van Dung et al. (2024b) |
Cattle rumen inoculum, in vitro | Incubation CH4 RR 0.845–0.904 at 48 h; 0.765–0.892 at 24 h | One pooled inoculum/batch; 5 technical vessels per treatment/time | No independent donor replication; response applies to the tested batch and does not establish animal-level mitigation. |
| Soybean oil and grape-seed tannin extract (S053) Lam Phuoc Thanh et al. (2022) | Cattle rumen inoculum, in vitro | Incubation CH4 RR 0.806–0.981; 5 comparisons at 48 h | 4 separate cow donors; donor-specific inocula | Same donors reused across diets; within-donor correlation unavailable; in vitro endpoint. |
| Jackfruit-leaf silage replacement (S132) Tran Thi Thuy Hang et al. (2024) | Goat rumen inoculum, in vitro | Incubation CH4 RR 0.726–1.015; 4 comparisons at 72 h | 4 separate goat donors; donor-specific inocula | Same donors reused across treatments; within-donor correlation unavailable; in vitro endpoint. |
| Tea-byproduct tannin within cottonseed-oil level (S028) Chu Manh Thang and Tran Hiep (2020) | Cattle, In vivo | CH4/DMI RR 0.887 and 1.074; CH4/live-weight-gain RR 0.879 and 1.072 | 24 cattle; 6 per active factorial arm | 0.5% versus 0.3% tannin within 1.5% or 3.0% oil; no untreated contrast; opposite directions are not an interaction test; emission estimate combines measured gas ratio with calculated CO2. |
RR = reported treatment/comparator mean ratio. Ranges describe selected point estimates; they do not provide uncertainty intervals, pooled effects or rankings. The first five rows represent seven In vivo experiments in five study families; these rows do not establish five independent biological clusters. S129 cross-experiment animal identity is not reported. The table covers the nine study families contributing locked numerical reconstruction; it is not a complete quantitative summary of all interventions in the 33-experiment map. Nitrate/NPN and other map-only programmes have no released ratios in this locked set and are retained in Tables 1 and S27. Animal donors are the source of the in vitro inoculum, not recipients of a demonstrated feeding intervention.
In S059, crude-protein digestibility was 67.9% in the control period and 64.3% in period 4 of the higher-dose run; the source reported P = 0.02 across periods . Because treatment followed control in a fixed sequence, this observation cannot isolate a causal dietary effect from time. In S129, total DM intake was 357, 361, 379 and 393 g/d across the Para-grass Mimosa levels (SEM 11.1; P= 0.16), and 442, 459, 464 and 471 g/d across the water-spinach Mimosa levels (SEM 13.0; P= 0.49); neither source omnibus test established a difference. These examples are a targeted source check, not a complete or pooled synthesis of productivity, and no missing co-outcomes were imputed.
In S036, source-reported methane yields were 22.4, 16.4, 10.2 and 8.58 L/kg DMI at 0, 1, 2 and 3% coconut oil, respectively, while daily weight gains were 80.0, 89.2, 93.3 and 78.4 g/day . At 3% versus 2%, yield was numerically lower but the source post-hoc groups overlap, daily gain was
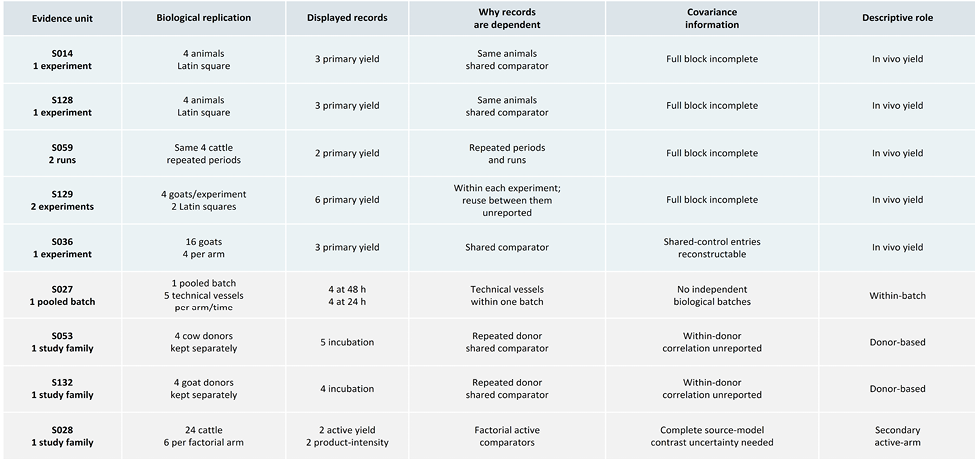
Dependence and covariance audit. The first five rows display the five study families contributing 17 primary In vivo comparisons from seven experiments. Each S129 experiment used a four-goat Latin square; cross-experiment animal identity is not reported. The family rows are display groups, not an asserted count of independent clusters. The remaining rows describe separate in vitro and secondary In vivo pathways. Biological animals or donors, technical vessels, repeated periods and effect records are distinguished explicitly. All comparisons remain descriptive; no covariance or independence is imputed across the two S129 experiments.
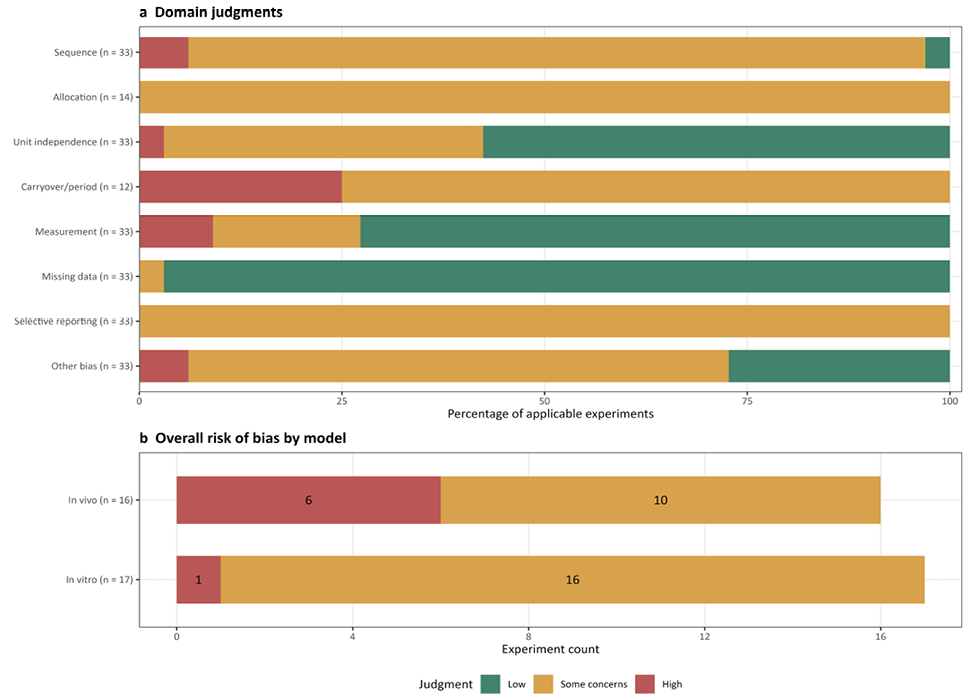
Risk-of-bias profile. Panel a shows domain percentages among applicable experiments, with the applicable denominator stated. Not-applicable entries are excluded from each denominator. Panel b shows overall counts by model: In vivo, 10 Some concerns and 6 High (n = 16); in vitro, 16 Some concerns and 1 High (n = 17). No experiment was Low overall. A complete experiment-level table retains all four domain categories. These counts describe the review and do not test whether biological model determines bias.
lower under the post-hoc grouping, although the 3% group also shares a letter with control. The source also reports CH₄ per g daily weight gain as 0.30, 0.17, 0.10 and 0.13 L/g (SE 0.02; overall P= 0.006); the 2% and 3% groups share the same post-hoc letter. We transcribe this source-reported metric and do not recalculate it. The growth and methane measurement windows are not fully reconstructible, so this metric is not harmonized or combined with other product-intensity results. Supplementary Table S29 records the source tables, treatment order and measurement context.
Risk of bias
Overall risk of bias was some concerns in 26 experiments and high in seven, none was Low. Sequence generation was some concerns in 30 and high in two. Unit independence was some concerns in 13 and high in one; carryover/period was some concerns in nine and high in three of 12 applicable experiments. Measurement was high in three, but low in 24; missing data was low in 32. Selective reporting was some concerns in all 33 because prospective outcome verification was unavailable. It was not judged High merely because a registration was absent. Supplementary Table S23 identifies the domains driving overall high judgments.
The seven overall high judgments were S016-E02/E03/E04, S032-E01, S035-E01 and S059-E01/E02. Their main concerns were a model/scale problem, one pen per treatment, drying method confounded with run, and fixed treatment sequences confounded with time, respectively.
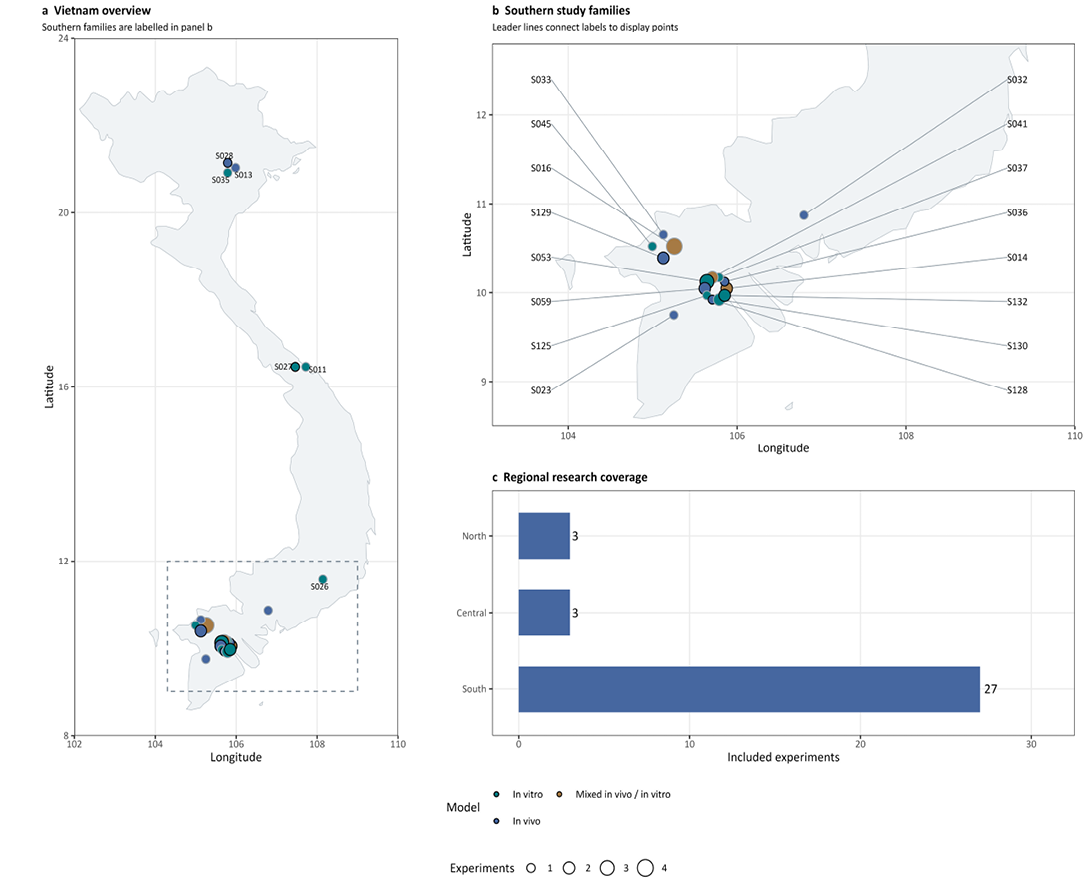
Research coverage of 22 study families and 33 experiments. Panel a maps seven approximate geographic reference points; panel b enlarges southern coverage and links labels to display points; panel c shows regional experiment counts. Stored coordinates and display offsets are unchanged; labels have separate positions. Points represent localities or an institutional proxy, using Google Maps coordinates obtained by the corresponding author. Locations do not imply current administrative boundaries. North, Central and South contain 3, 3 and 27 experiments, respectively. Counts are not weighted by ruminant population or emissions.
Six of 16 in vivo experiments (37.5%) and one of 17 in vitro experiments (5.9%) were high. This is a descriptive comparison, not a test of model type. Pooled inocula commonly limit biological generalization, but technical replication was not automatically scored as a critical high-risk mechanism.
Geographic coverage and evidence priorities
Sixteen of 22 study families and 27 of 33 experiments were mapped to southern Vietnam. The North and Central regions each had three families and three experiments; ten families were localized to Can Tho and four to An Giang. Seven of nine families containing effect reconstruction were southern. Removing the nine families without a universal untreated comparator left 20 experiments: 19 southern and one Central, with none in the North. Thus their inclusion increased geographic coverage and did not create the southern concentration; it still changed the mix of interventions represented. These are research-coverage counts, not estimates weighted to ruminant populations.
DISCUSSION
This review identified 24 reports describing 33 experiments in 22 study families. Eleven experiments supported numerical effect reconstruction. Its main result is an evidence map that separates study-specific quantitative information from the much smaller amount of independent information available for generalization.
The 17 selected methane-yield estimates showed a consistent direction of effect: each treatment/ comparator point estimate was below 1. This is a descriptive feature of the selected records. Several doses and experiments reused animals or comparators, so these values are not 17 independent confirmations. Their common direction does not demonstrate statistical significance, identify an unbiased intervention ranking or establish that methane would fall in another production system. Publication selection, incomplete quantitative verification, confounding and uncertainty may affect both direction and magnitude. Independent confirmatory trials are needed before efficacy recommendations.
The S027 vessel contrasts identify how one pooled inoculum responded to dose and incubation time. Such information can guide a replication design, while donor-independent batches are needed to test reproducibility. The two donor-based clusters, S053 and S132, showed values close to no change as well as larger reductions. These endpoints concern incubation methane; their animal-level relevance remains indirect and requires confirmation in feeding trials.
The complete evidence map remains the central contribution of the review. Lipid/oil interventions, forage and silage strategies, nitrate/NPN, biochar and tannin-rich feeds were tested under different species, designs, methane metrics and experimental units. Modelled methane and companion experiments without a methane assay add contextual information but are not interchangeable with directly measured CH₄/DMI. The reconstruction from report to study family to experiment to effect reveals a gap that paper-level summaries can obscure: Vietnam has a broader methane-mitigation literature than its available evidence suitable for quantitative synthesis.
Intervention class alone does not define a common biological question. Oil source and dose, tannin source, forage replacement and basal diet differed, as did cattle, goat and sheep populations and In vivo versus incubation conditions. Methane concentration, daily emission, CH₄/DMI and methane per unit live-weight gain have different denominators. Assays also ranged from gas chromatography and infrared measurements to gas-ratio methods coupled to calculated CO₂. A dimensionless RR preserves a within-study proportional comparison but does not remove these differences. Larger numerical reductions in one study should therefore not be interpreted as superior efficacy to a different intervention tested under another design or measurement system. Table 3 summarizes the intervention-specific scope and replication of the nine families with released numerical comparisons.
Lipid-based interventions were the largest intervention class and several experiments produced sizeable lower methane point estimates, consistent with biological plausibility and international literature ; . However, the Vietnamese lipid evidence spans fish oil, coconut oil, soybean oil, cashew-nut-shell liquid and other strategies under different basal diets and designs. The evidence therefore supports continued testing of locally relevant lipid strategies, not a comparative ranking or common effective dose.
For S028, the observed context was specifically cottonseed-oil level: increasing tea-byproduct tannin from 0.3% to 0.5% was associated with opposite methane-yield directions at 1.5% and 3.0% oil. Tannin chemistry, dose and digestion may also matter , but this review cannot assign the contrast to an unmeasured mechanism. Future factorial studies should report all cell means, the fitted oil × tannin interaction, error degrees of freedom and covariance, tannin characterization, total diet fat, intake, digestibility and growth. An untreated arm would answer an additional supplementation question; it is not a prerequisite for testing the interaction between the two studied factors.
Product intensity complements methane yield because productivity changes the denominator. A lower yield can coexist with unchanged or increased methane per kg product if growth or milk output falls. Conversely, an intensity reduction does not necessarily mean lower daily methane or lower total farm emissions. The S028 example illustrates why feed-based and product-based metrics should be reported together. Live-weight gain, raw milk, energy-corrected milk and carcass output require distinct definitions and cannot be pooled as one product denominator. A defensible expanded intensity synthesis would need source-verified outcomes, units, biological units and uncertainty for every included study.
The southern research concentration should not be equated with the distribution of Vietnam’s ruminant production. Published population context describes cattle and buffalo farming across the country and substantial extensive management . The concentration around Can Tho and An Giang is consistent with institutional access and research activity, but this review did not formally test institutional capacity against animal density. The map therefore supports a conclusion about uneven research coverage. It does not establish which region has the greatest mitigation opportunity. Multi-site studies should include northern and central systems, buffalo and commercial dairy populations, and local management conditions.
Under the stated overall rule, any applicable Some concerns judgment prevented an overall Low rating. Selective reporting was Some concerns in all 33 experiments because planned outcomes could not be checked prospectively; this domain alone therefore prevented overall Low classifications. The absence of Low ratings partly reflects this conservative rule and incomplete reporting rather than identified bias in every experiment. High ratings required a specific material mechanism. Accordingly, lack of prospective verification must not be described as proof that outcomes were suppressed. The specific High-risk mechanisms included confounding, unit errors and lack of independent treatment replication. The GRADE-adapted profiles express very low certainty for comparison-level conclusions; they do not imply that every observed value is wrong or that further testing is uninformative.
Universal selective-reporting concerns mean that planned outcomes could not be verified prospectively; they do not prove that all studies suppressed outcomes. Unpublished null or adverse responses could weaken the apparent lower-methane pattern. Theses and proceedings broadened discovery, but they cannot establish completeness. Small cluster counts precluded meaningful funnel-asymmetry testing. Exact reproducible searches, outcome verification and access to unpublished or author-provided data remain necessary to assess this uncertainty.
A major strength of this review is the explicit evidence hierarchy and the decision to withhold pooled inference when biological replication or sampling covariance could not be defended from the published record. Stable REPORT_ID, STUDY_ID, EXPERIMENT_ID and EFFECT_ID values make the reconstruction auditable and preserve the quantitative evidence for future reanalysis if animal-, donor- or contrast-level covariance becomes available. The review therefore separates what is numerically extractable from what is statistically defensible.
The main search procedure is partly dependent on retrospective author reporting. The authors clarified that recorded Boolean and deeper-pagination activity represented trial searches, but complete main-search strings, final source-specific settings, exact query-execution dates and query-to-record links remain unrecovered. Browser history establishes visited URLs rather than a complete record of retrieval and screening. The author-reported three-page Google Scholar limit and absence of backward or forward citation searching may have missed relevant publications. The observed directional pattern therefore describes the identified evidence and does not demonstrate complete coverage of Vietnamese ruminant methane research.
The review also has limited independent replication, heterogeneous outcome definitions and uneven spatial coverage. Published-data covariance remained incomplete for key repeated-animal clusters. The quantitative subset reflects incomplete verification as well as numerical availability, so selection could affect the observed direction and magnitude. The targeted productivity examples are not a complete inventory, and the S028 intensity extension remains one illustrative experiment. Independent duplicate extraction and risk-of-bias assessment were not performed, and additional data were not requested from original study authors. The geographic map uses approximate locality or institutional reference points rather than precise farm coordinates. The supplied R011 journal version was compared with the archived preprint: numerical entries in Tables 1–5 and the reported design agreed. Its methane table still reports factorial marginal means, so the experiment remains in the evidence map without a released pairwise effect.
Future trials should report directly measured daily methane, methane yield and product intensity with clearly defined units. They should identify the independent animal, pen, donor or batch; preserve those identifiers; and provide model-error, contrast-variance and covariance information. Crossover studies should report randomized sequences, period handling and adaptation. Independent farms, herds or donor batches are needed alongside joint measurements of intake, digestion, productivity and health. Intervention-specific questions should be retained when planning broader geographic replication.
CONCLUSIONS AND RECOMMENDATIONS
The available animal experiments show a consistent trend towards lower methane yield among the selected comparisons, identifying nutritional strategies worth independent testing. This descriptive trend does not establish statistical significance for each comparison. The evidence does not define a common national reduction or establish comparative intervention rankings. Better biological replication, transparent search and covariance reporting, and joint methane/productivity measurements are needed to support broader recommendations.
ACKNOWLEDGEMENTS
The authors thank the researchers whose published work contributed to the Vietnamese evidence base synthesized in this review.
NOVELTY STATEMENT
This study links Vietnamese nutritional methane-mitigation reports to related study families, experiments and numerical contrasts. Its contribution is a transparent distinction between the breadth of experimental coverage and the independence and uncertainty needed for quantitative inference. The map and audit identify intervention-specific and geographic priorities without claiming a pooled national effect.
AUTHOR’S CONTRIBUTION
HTK: Conceptualization, methodology, investigation, data curation, formal analysis, visualization, writing original draft, writing review and editing, and project administration. VHNP: Investigation, validation, data curation, and writing review and editing. CDT, NTAH and NTPT: Investigation, validation, and writing review and editing. HQD: Supervision, methodology, validation, and writing review and editing.
Funding
The authors received no specific funding for this study.
Data availability
The locked effect dataset, evidence-audit tables and figure-input tables are provided in the accompanying Supplementary data and R code V14 package. Study and effect identifiers link these data to Supplementary Tables S1–S29. The V14 addendum includes the experiment-disposition ledger, a sanitized recovered-query inventory and source locators for the targeted productivity examples. Historical search records do not constitute a complete executable main-search strategy.
Code availability
The descriptive R workflow, package-installation script, locked input tables and checked V13.1 outputs are preserved in Supplementary Data and R Code V14. The package adds the base R script and checked inputs for the V14 Figures 3 and 4 redraw. The 4 October 2026 execution log and session information document the preceding V13.1 run; they do not describe a new V14 execution of the complete workflow. Earlier exploratory pooling code is historical and supplies no current pooled estimate. The V14 figure addendum was checked against all 47 locked ratios and the 17-record primary display; no new effect-release cycle or inferential analysis was performed.
Ethics approval
Not applicable. This study synthesised data from published and publicly accessible reports and involved no new human participants or animals.
Generative AI and AI assisted technology statement
The authors declare that no generative AI and AI assisted technology was used in the creation of this manuscript.
Supplementary material
There is supplementary material associated with this article. Access the material online at: https://dx.doi.org/10.17582/journal.aavs/2026/14.12.2843.2861
Conflict of interest
The authors declare no conflict of interest.
References
- Almeida, AK, Hegarty, RS, Cowie A (2021). Meta-analysis quantifying the potential of dietary additives and rumen modifiers for methane mitigation in ruminant production systems. Anim. Nutr., 7: 1219–1230. https://doi.org/10.1016/j.aninu.2021.09.005 [CrossRef]
- Arndt C, Hristov AN, Price WJ, McClelland SC, Pelaez AM, Cueva SF, Oh J, Dijkstra J, Bannink A, Bayat AR, Crompton LA, Eugéne MA, Enahoro D, Kebreab E, Kreuzer M, McGee M, Martin C, Newbold CJ, Reynolds CK, Schwarm A, Shingfield KJ, Veneman JB, Yáñez-Ruiz DR, Yu Z (2022). Full adoption of the most effective strategies to mitigate methane emissions by ruminants can help meet the 1.5 °C target by 2030 but not 2050. Proc. Natl. Acad. Sci. USA, 119: e2111294119. https://doi.org/10.1073/pnas.2111294119 [CrossRef]
- Cardoso-Gutierrez E, Aranda-Aguirre E, Robles-Jimenez LE, Castelán-Ortega OA, Chay-Canul AJ, Foggi G, Angeles-Hernandez JC, Vargas-Bello-Pérez E, González-Ronquillo M (2021). Effect of tannins from tropical plants on methane production from ruminants: A systematic review. Vet. Anim. Sci., 14: 100214. https://doi.org/10.1016/j.vas.2021.100214 [CrossRef]
- Chu MT, Tran H (2020). Combined effects of cottonseed oil and tannin from tea by-products (Camellia sinensis) supplementation on nutrient digestibility, performance and enteric methane production of fattening cattle. Adv. Anim. Vet. Sci., 8: 633–638. https://doi.org/10.17582/journal.aavs/2020/8.6.633.638 [CrossRef]
- Chu MT, Dao TBA, Ngo DT, Le TTH, Pham DL, Tran TBN, Nguyen TT, Roger ST (2025). Methane yield and beef cattle productivity arising from the principal diets feed in the dry and rainy season of Vietnam. J. Anim. Sci. Technol. (Vietnam), 153: 34–42. https://doi.org/10.70408/nias.i153-y2025-686 [CrossRef]
- D Mo and Nguyen VT (2025). Manipulating concentrate level in the diet of tropical cattle to improve fiber utilization and mitigate greenhouse gas emissions. J. Indones. Trop. Anim. Agric., 50: 246–256. https://doi.org/10.14710/jitaa.50.4.246-256 [CrossRef]
- Dinh VD, Le DP, Le DN, Roubík H (2024b). Effects of levels of tropical rice husk-derived biochar in diet-based high rice straw on in vitro methane production and rumen fermentation. Biomass Convers. Biorefin. 14: 27225–27231. https://doi.org/10.1007/s13399-022-03431-y [CrossRef]
- Dinh VD, Le DT, Le DN, Le DP, Roubík H (2024a). Effects of biochar produced from tropical rice straw, corncob, and bamboo tree at different processing temperatures on in vitro rumen fermentation and methane production. Biomass Convers. Biorefin. 14: 2577–2584. https://doi.org/10.1007/s13399-022-02592-0 [CrossRef]
- Gunasekara U, Bertram MR, Nguyen VL, Phan QM, Vo DC, Perez A, Arzt J, VanderWaal K (2023). Phylogeography as a proxy for population connectivity for spatial modeling of foot-and-mouth disease outbreaks in Vietnam. Viruses, 15(2): 388. https://doi.org/10.3390/v15020388 [CrossRef]
- Ho TK, Vo QM, Ho QD (2025). Lauric acid mitigates heat stress-induced methane emissions and fermentation inefficiency by modulating microbial populations in the rumen of Bach Thao Goat. J. Ecol. Eng., 26: 49–59. https://doi.org/10.12911/22998993/204766 [CrossRef]
- Hooijmans CR, Rovers MR, de Vries RBM, Leenaars M, Ritskes-Hoitinga M, Langendam MW (2014). SYRCLE’s risk of bias tool for animal studies. BMC Med. Res. Methodol., 14: 43. https://doi.org/10.1186/1471-2288-14-43 [CrossRef]
- Inthapanya S (2012). Mitigation of methane production from ruminants; effect of nitrate and urea on methane production in an in vitro system and on growth performance and methane emissions in growing cattle. Can Tho University MSc thesis.
- Jayanegara A, Leiber F, Kreuzer M (2012). Meta-analysis of the relationship between dietary tannin level and methane formation in ruminants from in-vivo and in-vitro experiments. J. Anim. Physiol. Anim. Nutr., 96: 365–375. https://doi.org/10.1111/j.1439-0396.2011.01172.x [CrossRef]
- Lam PT, Nguyen TTH, Tran TTH (2020). Effect of oils and grape seed proanthocyanidin extract on ruminal fermentation and methane production in dairy goats. J. Anim. Sci. Technol. (Vietnam), 116: 2–8.
- Lam PT, Pham TTK, Loor JJ, Tran TTH (2022). Grape seed tannin extract and polyunsaturated fatty acids affect in vitro ruminal fermentation and methane production. J. Anim. Sci., 100: skac039. https://doi.org/10.1093/jas/skac039 [CrossRef]
- Le TNH, Ho QD, Preston TR, Leng RA (2010). Nitrate as fermentable nitrogen supplement to reduce rumen methane production. Livest. Res. Rural Dev., 22: Article 146
- Le TTH, Preston TR, Nguyen XB, Dinh VD (2019). Effect of biochar on growth and methane emissions of goats fed fresh cassava foliage. Livest. Res. Rural Dev. 31, Article 67. https://www.lrrd.org/lrrd31/5/thuyhang31067.html
- Maeda, K, Nguyen, VT, Suzuki, T, Yamada, K, Kudo, K, Hikita, C, Le, VP, Nguyen, MC, Yoshida N (2021). Network analysis and functional estimation of the microbiome reveal the effects of cashew nut shell liquid feeding on methanogen behaviour in the rumen. Microb. Biotechnol., 14: 277–290. https://doi.org/10.1111/1751-7915.13702 [CrossRef]
- Nguyen BT, Tran TT (2025). Effect of energy sources and tra fish oil in the diet on nutrient digestibility and methane emissions of fattening beef cattle. J. Anim. Health Prod., 13: 721–728. https://doi.org/10.17582/journal.jahp/2025/13.3.721.728 [CrossRef]
- Nguyen HT, Nguyen LV, Le PBT, Pham TP, Nguyen DKT, Nguyen NMT, Dang ANT (2025). Common agricultural byproducts with high potential as beef cattle feed associated with methane emissions in some districts of Lam Dong Province, Vietnam. Adv. Anim. Vet. Sci., 13(10): 2147-2159. https://doi.org/10.17582/journal.aavs/2025/13.10.2147.2159 [CrossRef]
- Nguyen BT, Tran TT (2026). Charolais crossbred cattle: The difference in energy sources and ages on nutrient digestibility and methane emission. Asian J. Agric. Biol., 2026: e2025249. https://doi.org/10.35495/ajab.2025.249 [CrossRef]
- Nguyen TD, Duong NK (2016). Effect of coconut (Cocos nucifera) meal on growth and rumen methane production of Sindhi cattle fed cassava (Manihot esculenta, Crantz) pulp and Elephant grass (Pennisetum purpureum). Livest. Res. Rural Dev., 28: Article 197.
- Nguyen TKD, Nguyen VT (2018). Dietary supplementation of coconut oil markedly suppressed enteric methane production without compromising growth performance in Bach Thao goats. Proc. 4th Int. Asian-Australas. Dairy Goat Conf., pp. 392–399.
- Nguyen TTH, Nguyen TNT, Duong NK (2021). Effect of Mimosa pigra on methane emissions from growing goats. Livest. Res. Rural Dev. 33, Article 54.
- Nguyen VT (2020). In vivo greenhouse gases emissions, nutrient intake, digestibility and rumen parameters of growing sheep affected by dietary silage sources. J. Anim. Sci. Technol. (Vietnam), 108: 63–72.
- Nguyen Van Thu and Nguyen Thi Kim Dong (2021). A study of in vitro and In vivo greenhouse gas emissions, digestion, rumen environment and nitrogen retention of growing crossbred cattle supplemented by Catfish oil. Livest. Res. Rural Dev., 33: Article 68
- Page MJ, McKenzie JE, Bossuyt PM, Boutron I, Hoffmann TC, Mulrow CD, Shamseer L, Tetzlaff JM, Akl EA, Brennan SE, Chou R, Glanville J, Grimshaw JM, Hróbjartsson A, Lalu MM, Li T, Loder EW, Mayo-Wilson E, McDonald S, McGuinness LA, Stewart LA, Thomas J, Tricco AC, Welch VA, Whiting P, Moher D (2021). The PRISMA 2020 statement: An updated guideline for reporting systematic reviews. Br. Med. J., 372: n71. https://doi.org/10.1136/bmj.n71 [CrossRef]
- Patra AK (2013). The effect of dietary fats on methane emissions, and its other effects on digestibility, rumen fermentation and lactation performance in cattle: A meta-analysis. Livest. Sci., 155: 244–254. https://doi.org/10.1016/j.livsci.2013.05.023 [CrossRef]
- Pustejovsky JE, Tipton E (2018). Small-sample methods for cluster-robust variance estimation and hypothesis testing in fixed effects models. J. Bus. Econ. Stat., 36: 672–683. https://doi.org/10.1080/07350015.2016.1247004 [CrossRef]
- Schünemann HJ, Higgins JPT, Vist GE, Glasziou P, Akl EA, Skoetz N, Guyatt GH (2024). Chapter 14: Completing Summary of findings tables and grading the certainty of the evidence. In: Higgins JPT et al., editors. Cochrane Handbook for Systematic Reviews of Interventions, version 6.5. https://www.cochrane.org/authors/handbooks-and-manuals/handbook/current/chapter-14
- Socialist Republic of Viet Nam (2022). Nationally determined contribution (NDC), 2022 update. UNFCCC.
- Tran TTH, Vo TPT, Tang QP, Lam PT (2024). Jackfruit leaves silage greatly reduces methane production without affecting ruminal fermentation and digestibility. Agric. Rural Dev. Sci. Technol., 7(2): 53–60.
- Tran TT, Nguyen BT (2025). Effect of Tra catfish oil and starch sources on nutrient digestibility and methane emission of Charolais crossbred cattle at 17-20 months of age. Livest. Res. Rural Dev., 37: Article 44
- Truong TT, Xu M, Tran LH, Nguyen VT (2026). Effects of different water-soluble nitrogen in diets on in vitro digestibility and gas production. J. Appl. Anim. Res., 54: 2630927. https://doi.org/10.1080/09712119.2026.2630927 [CrossRef]
- Viechtbauer W (2010). Conducting meta-analyses in R with the metafor package. J. Stat. Softw., 36: 1–48. https://doi.org/10.18637/jss.v036.i03 [CrossRef]
- Winding S (2014). Methane emission from nitrate-treated tannin rich feed for cattle in Vietnam. Swedish University of Agricultural Sciences bachelor thesis
Supplementary material

Services
Article usage statistics
Loading…
Related articles
- Nutritional Strategies Targeting the Metabolic Oxidative Immune Axis for Mastitis Risk Reduction in Dairy Cattle: A Systematic ReviewAdvances in Animal and Veterinary Sciences · 2026
- The Dietary Hemp–Gut Microbiome Interplay in Ruminants and Broilers: A Narrative Review in Livestock NutritionAdvances in Animal and Veterinary Sciences · 2026
- Nutritional Interventions to Improve Immune Function in CattleJournal of Animal Health and Production · 2025
- Toll-Like Receptor Gene Polymorphisms and their Relationship with Performance and Immune Response in Sheep: A Systematic ReviewJournal of Animal Health and Production · 2026
- Nutritional Evaluation of Total Mixed Ration Silages Containing Maggot (Hermetia illucens) as Ruminant FeedsJournal of Animal Health and Production · 2020
- Performance and Estimation of Enteric Methane Emission from Fattening Vietnamese Yellow Cattle Fed Different Crude Protein and Concentrate Levels in the DietAdvances in Animal and Veterinary Sciences · 2019