
Effects of Feeding Thyme, Rosemary, and Oregano Powder Supplementation on Broiler Chickens: Performance, Meat Quality, Hematology and Serum Biochemistry


Effects of Feeding Thyme, Rosemary, and Oregano Powder Supplementation on Broiler Chickens: Performance, Meat Quality, Hematology and Serum Biochemistry
Anguara Khatun1*, Ankon Lahiry2, Nusrat Jahan Nishat1, Maksuda Begum3, Bibek Chandra Roy4, Shubash Chandra Das1
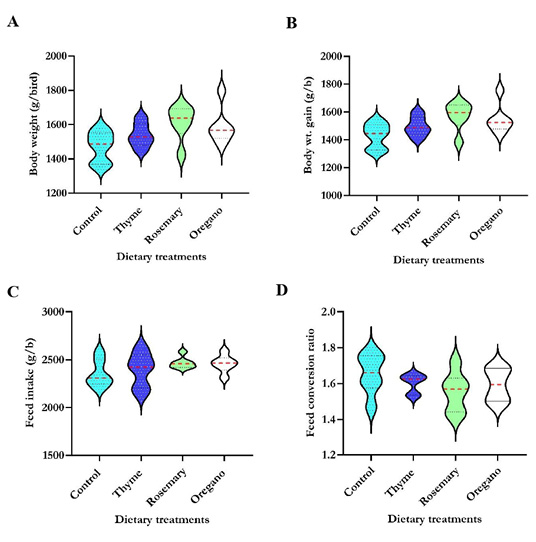
The violin plots show the final body weight(A), body weight gain (B), feed intake (C) and feed conversion ratio (D) of control and other supplemented groups (thyme (5g/kg), rosemary (5g/kg) and oregano (5g/kg)). The box represents the 95% confidence interval of the data, and the horizontal red line represents the mean values. Though they vary numerically, none of the growth parameters did not differs significantly from the others.
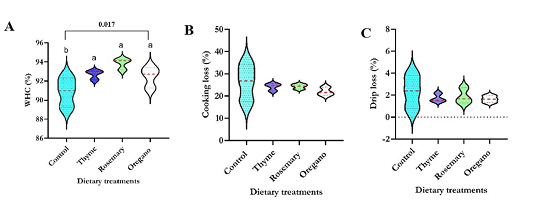
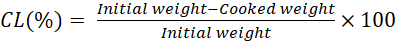
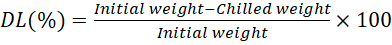
The violin plots illustrate the water holding capacity (A), cooking loss (B) and drip loss (C) of broiler chicken meat quality. Four dietary groups such as control group, thyme (5g/kg), rosemary (5g/kg) and oregano (5g/kg) supplemented group. The box represents the 95% confidence interval of the data, and the horizontal red line represents the mean values. a.b within a column, exhibit the stated level of significant differences (P-0.017).
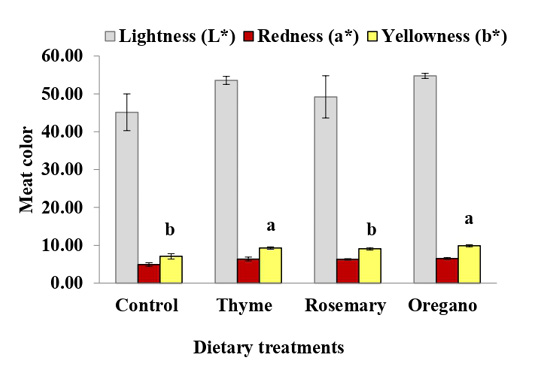
The bar graph indicates the three different colors (lightness, redness and yellowness) of breast meat of broiler chickens. There were four dietary groups: control, thyme (5g/kg), rosemary (5g/kg), and oregano (5g/kg). a, b values with distinct alphabetic superscripts within a column exhibit the stated level of significant differences (P=0.003). Bar indicates the standard error of mean.
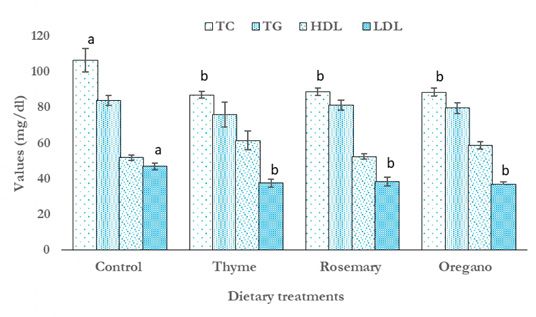
The bar graph shows the effects of feeding thyme, rosemary, and oregano powder on the lipid profiles of broiler chickens. There were four treatment groups like control, thyme (5g/kg), rosemary (5g/kg), and oregano (5g/kg) groups. ab within a column, values with different alphabetic superscripts differ significantly (P <0.05). Here, TC-Total cholesterol, TG-Triglyceride, HDL-High density lipoprotein, LDL-Low density lipo-protein. mg/dl-milligrams per deciliter. Bar indicates the standard error of mean.
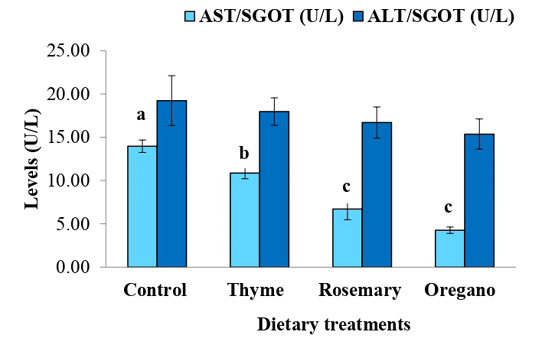
The bar graph demonstrates the effects of feeding thyme, rosemary, and oregano powder on the liver enzymes of broiler chickens. There were four different dietary groups. be Within a column, values with different alphabetic superscripts differ significantly (P<0.001). Here, AST-Aspartate amino transferase, ALT-Alanine amino transferase. U/L= units per liter.


