

Transcriptional Regulation of Spermatogenesis-Related Gene CDK16 in Banna Mini-Pig Inbred Line


Transcriptional Regulation of Spermatogenesis-Related Gene CDK16 in Banna Mini-Pig Inbred Line
Hongmei Dai1, Shixiong Xu1, Zhipeng Liu1, Hailong Huo2, Fuhua Yang1, Xia Zhang3* and Jinlong Huo1,4*

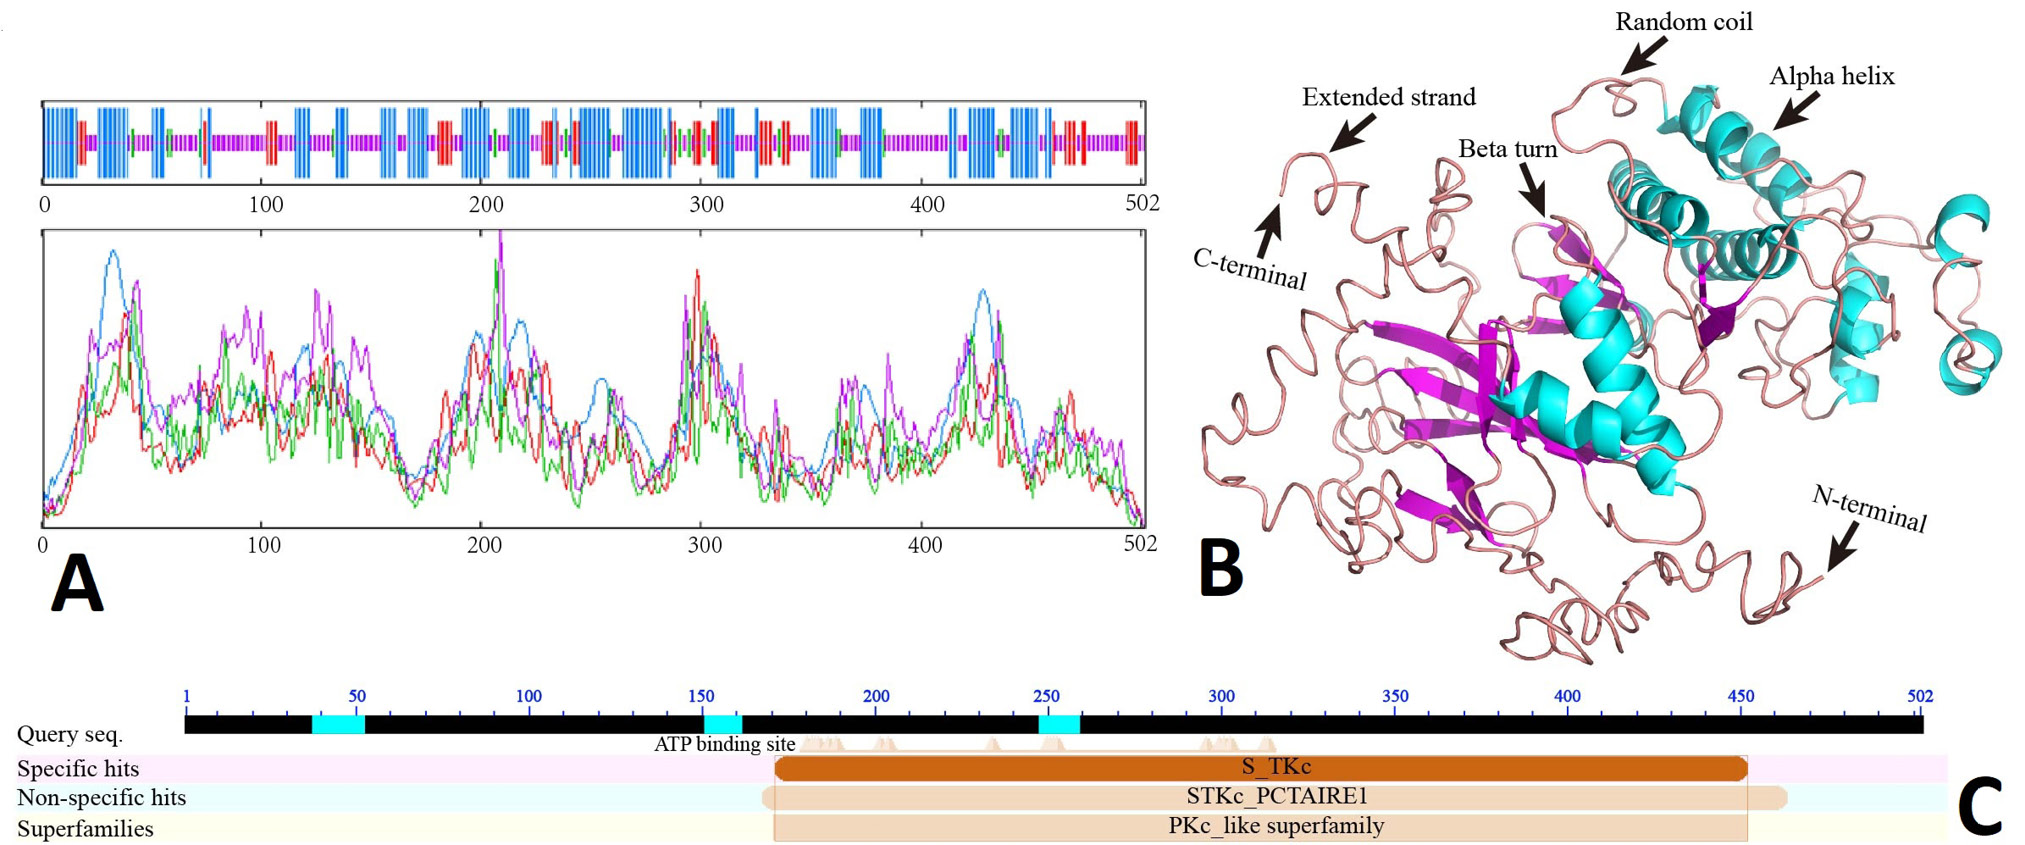
Analysis of expression and encoding protein of CDK16. A, chromosome location and exon, intron abundance of CDK16 based on RNA-seq. B, RT-PCR product of CDK16. M. DL2000 DNA Marker. C, CDK16 CDS and encoding amino acids. The colored shade represents the conserved domain S_TKc (amino acid positions 171-452). D, ORF analysis of CDK16 cDNA.

Interaction network of CDK16. A, Protein-protein Interaction networks. The lines connected proteins indicated the interactions with each other, and more lines indicated higher confidence level. B, Interaction network of KEGG enrichment of CDK16. C, Interaction network of GO enrichment of CDK16, including proteins and the pathways related to biological process, cellular component and molecular function. D, Chord plot of genes that were correlated with CDK16. The wathet lines within the circle indicated significant correlation.
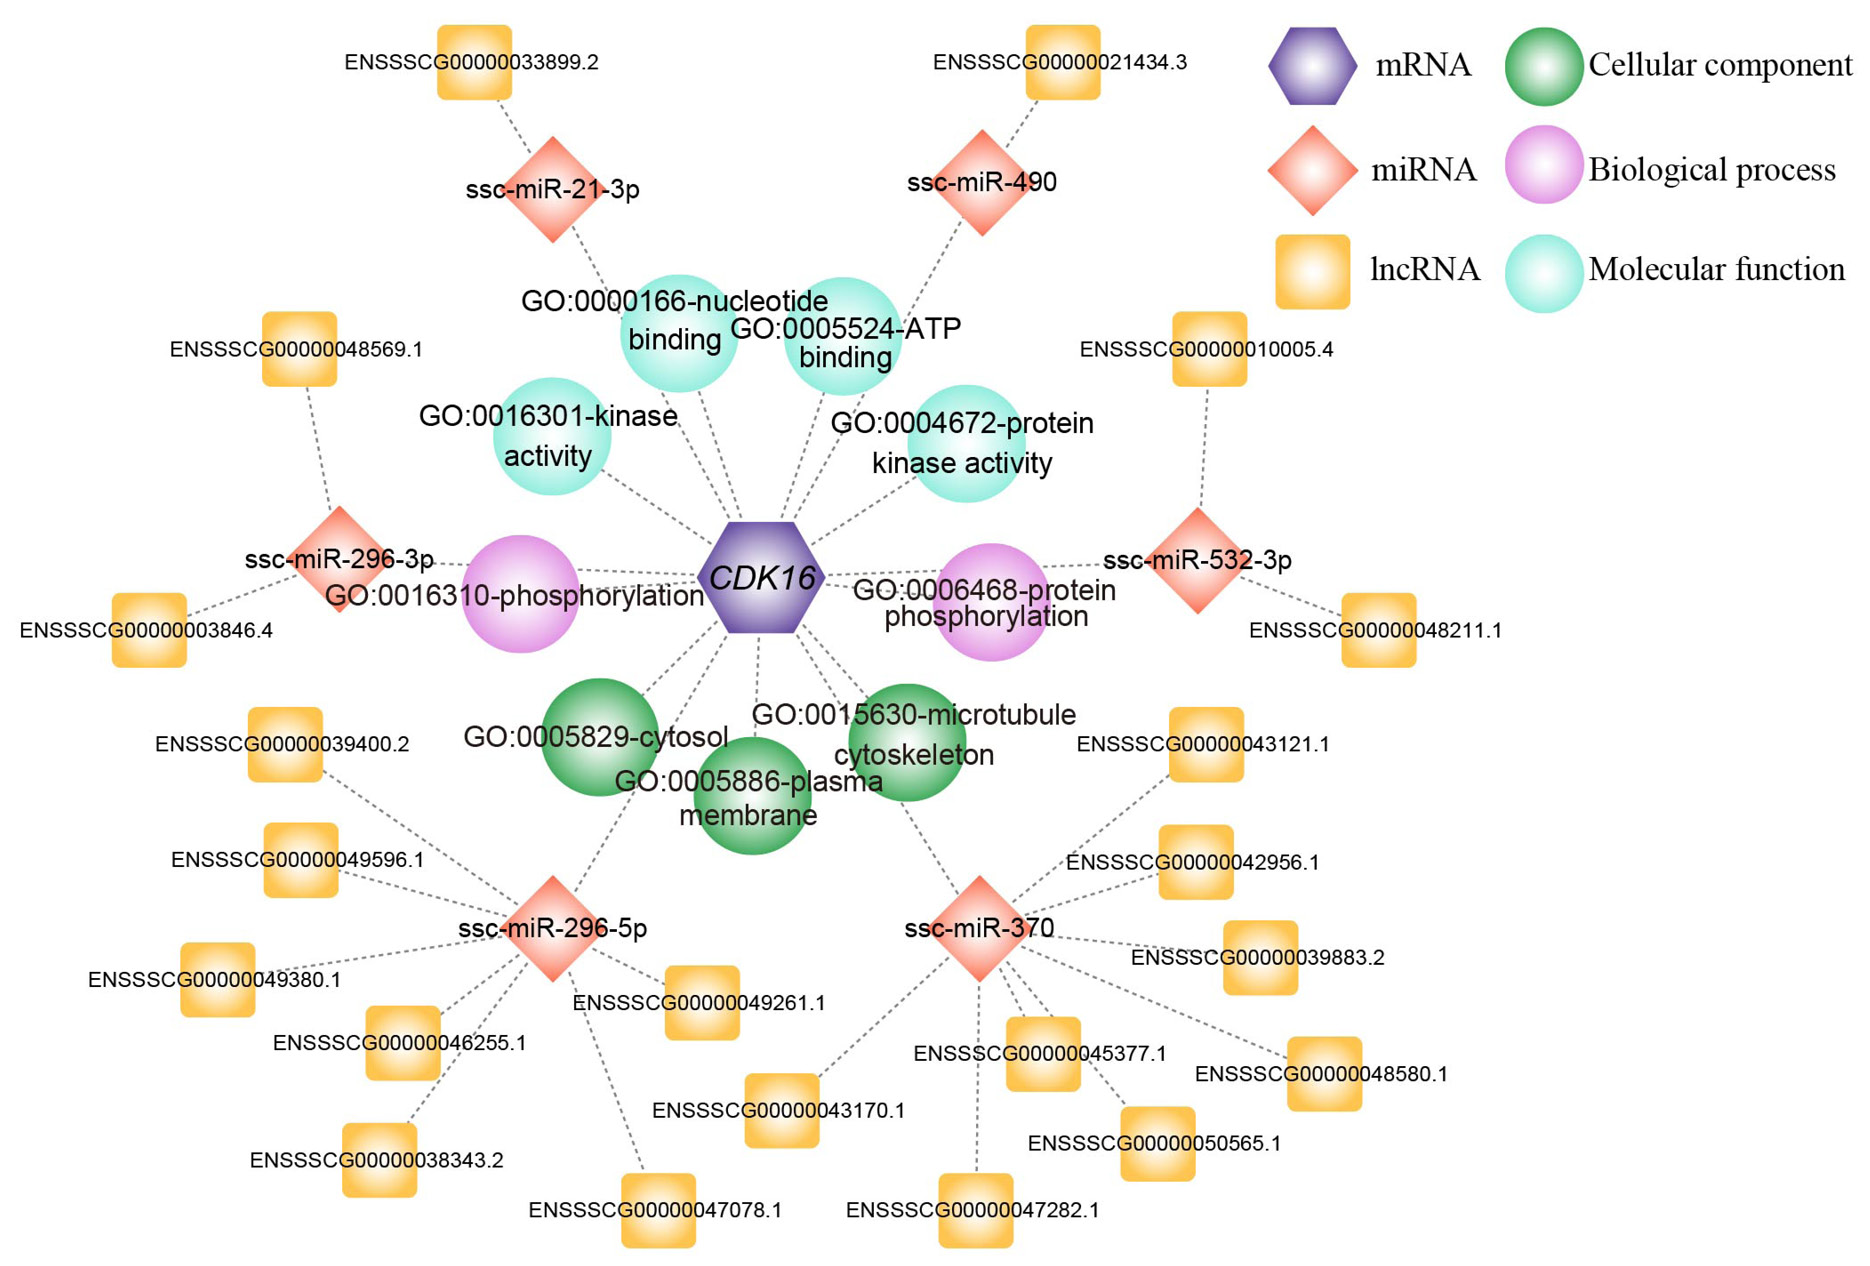
The functional annotation of CDK16 and regulatory network of CDK16-miRNA-lncRNA. The different elements of this network were represented by hexagon, rhombus, square, and sphere, which correspond to CDK16 mRNA, miRNA, lncRNA and GO pathways including green cellular component, pink biological process and blue molecular function.

