
Agrobacterium Mediated Transformation of OsTZF8 Gene in Oryza sativa for Drought Stress Tolerance


Agrobacterium Mediated Transformation of OsTZF8 Gene in Oryza sativa for Drought Stress Tolerance
Muhammad Medrar Hussain*, Asad Jan* and Sayyar Khan Kazi
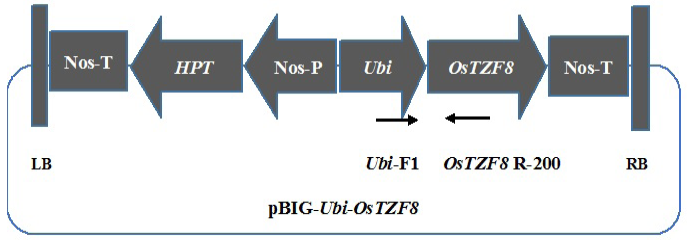
pBIG-Ubi-OsTZF8 construct map having OsTZF8 gene and selectable marker gene hygromycin phosphotransferase (HPT). Total size of pBIG-Ubi-OsTZF8 construct was 14249 bp.
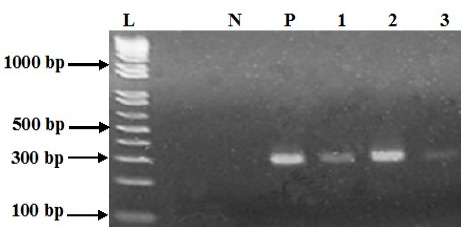
PCR confirmation of Agrobacterium (EHA-105) colonies transformed with pBIG-Ubi-OsTZF8; Lane 1-3: DNA from Agrobacterium colonies; P) Positive control; N) Negative control; L) Ladder.
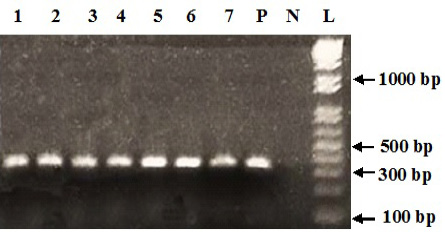
Gel electrophoresis of PCR amplified DNA bands of transformed calli having pBIG-Ubi-OsTZF8 construct. Lane 1 to 7: DNA samples from different calli; P) Positive control; N) Negative control; L) Ladder.
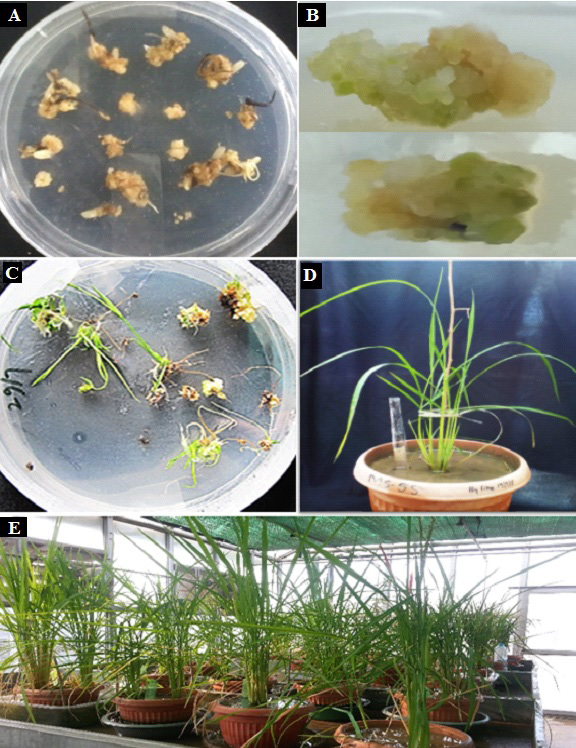
Different stages of OsTZF8-OX transgenic indica rice plants generation; (A) Callus induced from rice seeds; (B) Calli regeneration; (C) Plantlets regeneration; (D) Plants transferred to soil; (E) Plants transferred to green house for acclimatization.
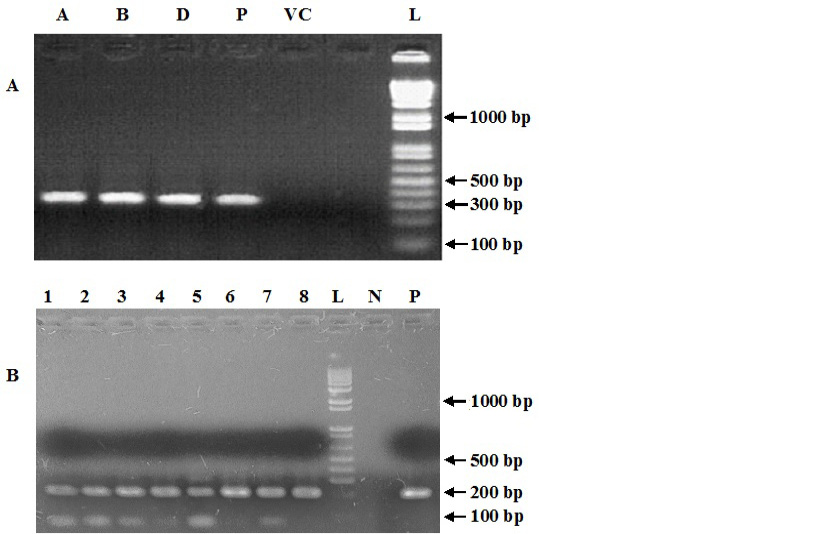
Molecular confirmation of OsTZF8-OX and HPT genes in indica rice; (A) Gel electrophoresis of PCR amplified samples of indica OsTZF8-OX transformed plants; Lane A, B, D: DNA bands of transgenic indica rice; (B) Gel electrophoresis of PCR amplified DNA bands of transgenic rice plants having HPT gene; Lane 1 to 8: DNA samples from different calli; P) positive control; VC) Vector control; N) negative control; L) Ladder.
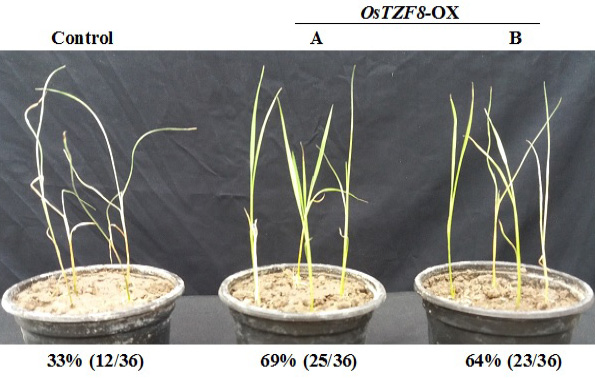
Drought stress tolerance analysis in control and indica OsTZF8-OX transgenic lines. The transgenic line A (69%) and B (64%) exhibited high drought tolerance compared to control (33%) plants. t-test was used for statistical analysis (P = 0.04, P < 0.05).
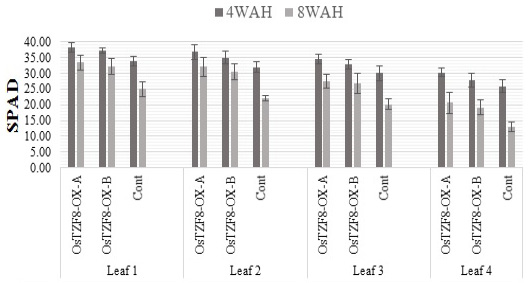
Chlorophyll analysis of OsTZF8-OX transgenic indica lines and control. The measurement was carried out at 4 and 8 WAH. Due to OsTZF8 gene overexpression, all four leaves of transgenic line A and B showed high chlorophyll content in comparison to control. SPAD is the unit of chlorophyll measurement on SPAD meter.
