Antibacterial Sodium Alginate Cosmetic Herbal Electrospun Nanofiber Mask
Antibacterial Sodium Alginate Cosmetic Herbal Electrospun Nanofiber Mask
Ayesha Saeed1*, Farzana Kishwar2, Ahsan Nazir3, Sharjeel Abid4, Muhammad Abiodullah5, and Danial Ali6
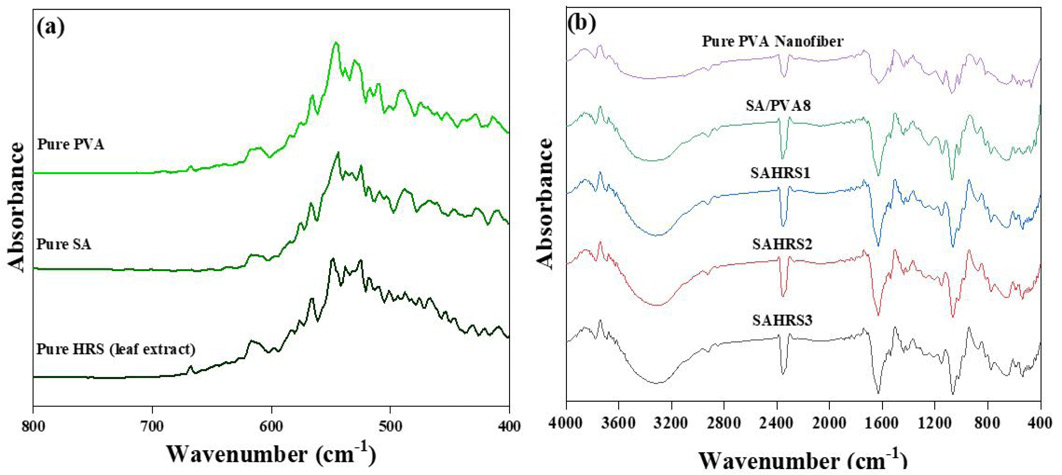
FTIR Spectrum of (a) pure PVA, SA and HRS leaf extract, (b) pure PVA SA/PVA8, SAHRS1, SAHRS2 and SAHRS3 nanofibers at different concentrations.
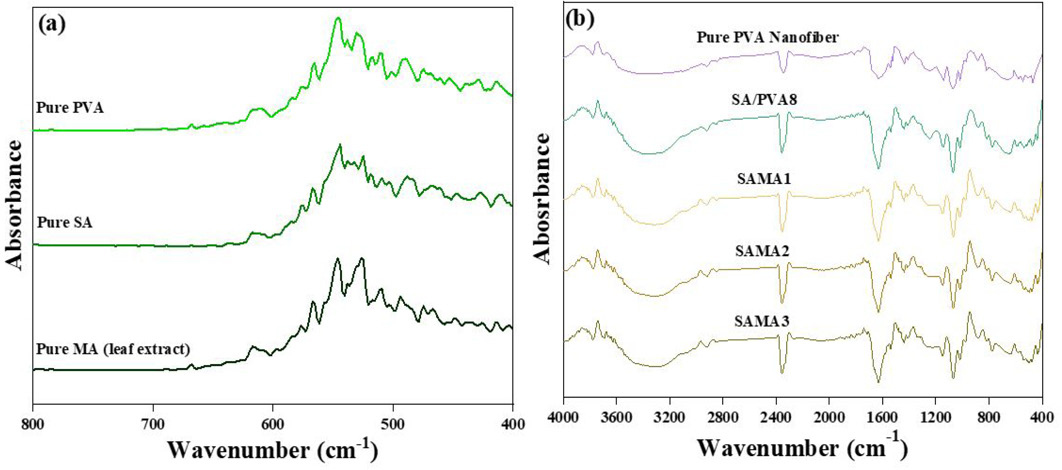
FTIR Spectrum of (a) pure PVA, SA and MA leaf extract, (b) pure PVA, SA/PVA8, SAMA1, SAMA2 and SAMA3 nanofibers at different concentrations.
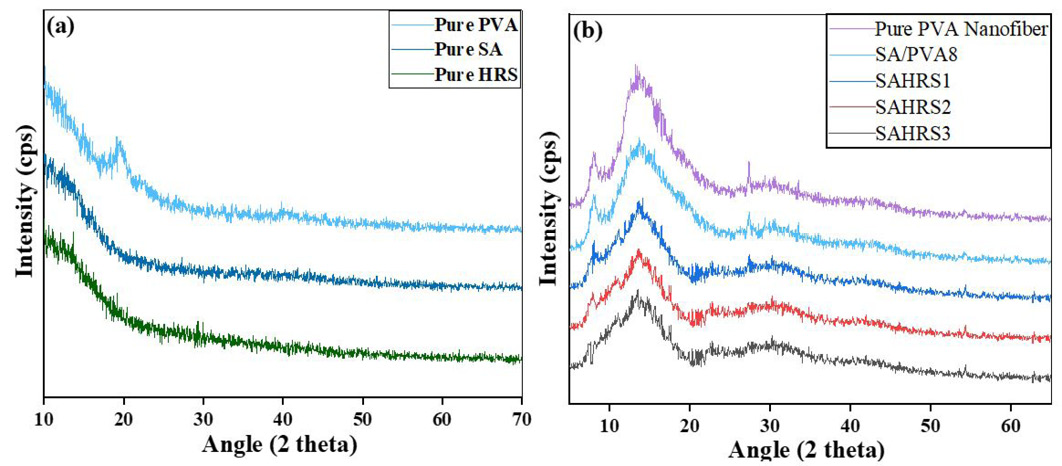
XRD pattern of (a) pure PVA, SA and HRS (b) pure PVA, SA/PVA8, SAHRS1, SAHRS2 and SAHRS3 Nanofibers.
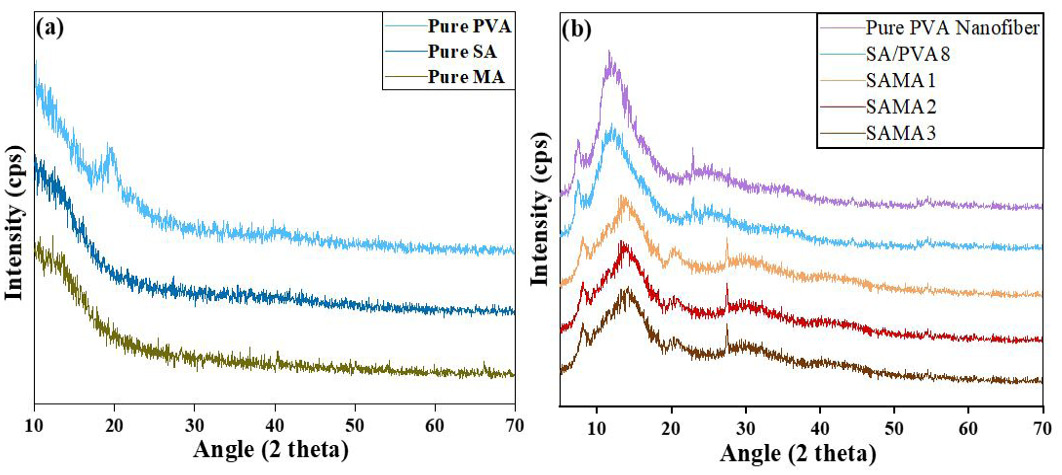
XRD pattern of (a) pure PVA, SA and MA (b) pure PVA, SA/PVA8, SAMA1, SAMA2 and SAMA3 Nanofibers.
SEM images of nanofibers at different ratios of SA/PVA at magnification level of (a) 10000, (b) 5000, (c) 1000, (d) 5000, (e) 10,000.
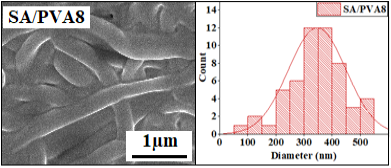
SEM images (magnification level of 30x) of SA/PVA8 nanofibers and Diameter distribution.
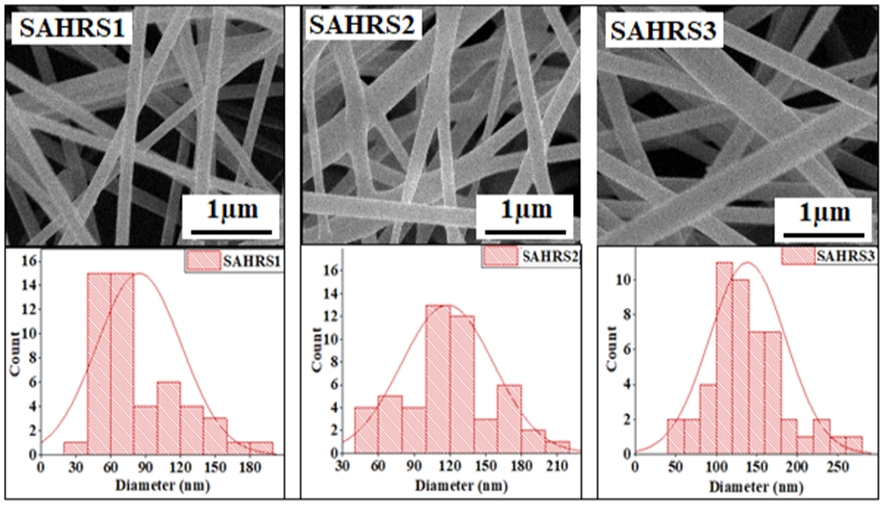
SEM images (magnification level of 30x) of SAHRS1, SAHRS2, SAHRS3 nanofibers at 0.5, 1 and 1.5% concentrations and Diameter distribution.
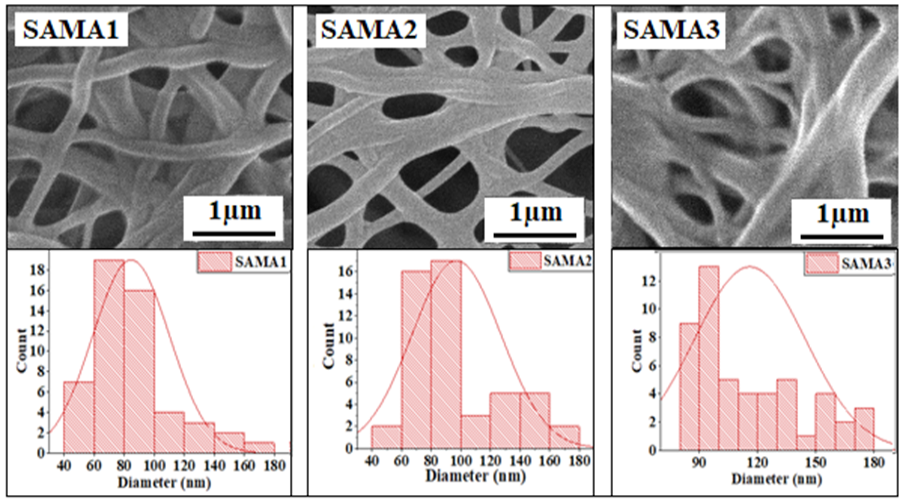
SEM images (magnification level of 30x) of SAMA1, SAMA2, SAMA3 nanofibers at 0.5, 1 and 1.5% concentrations and Diameter distribution
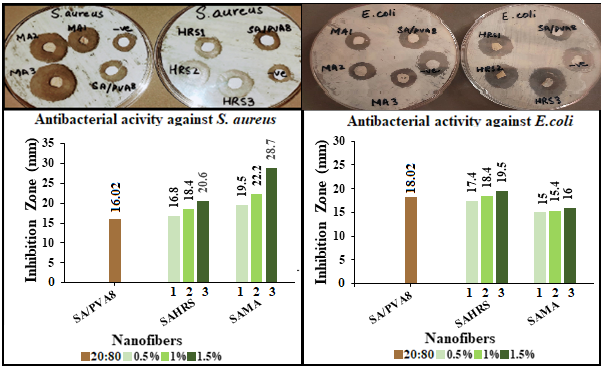
Antibacterial activity of with and without laef extract nanofibers against S. aureus and E. coli.


