Application of MATLAB for Designing and Simulation of High-Efficiency Center Pivot Irrigation System
Application of MATLAB for Designing and Simulation of High-Efficiency Center Pivot Irrigation System
Filza Fatima Rizvi1*, Waqar khan2, Syed Mohsin Raza Kazmi3 and Muhammad Umer4
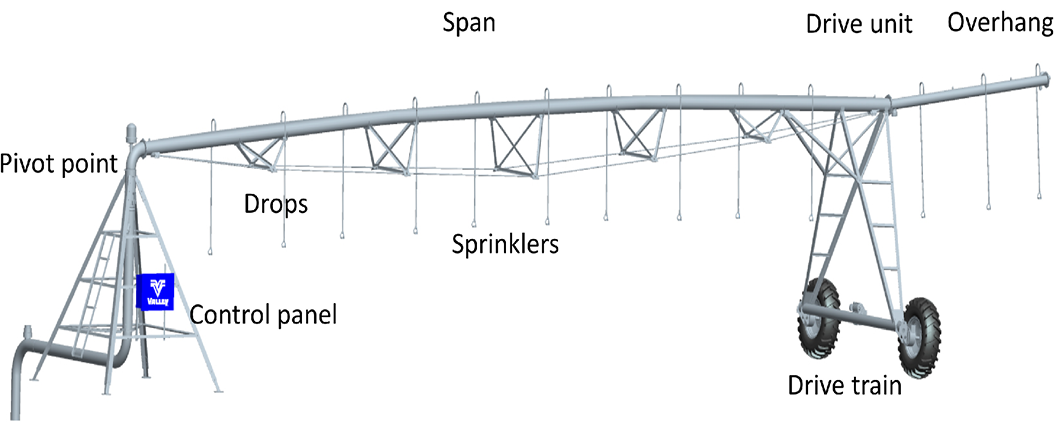
Valley irrigation-USA.
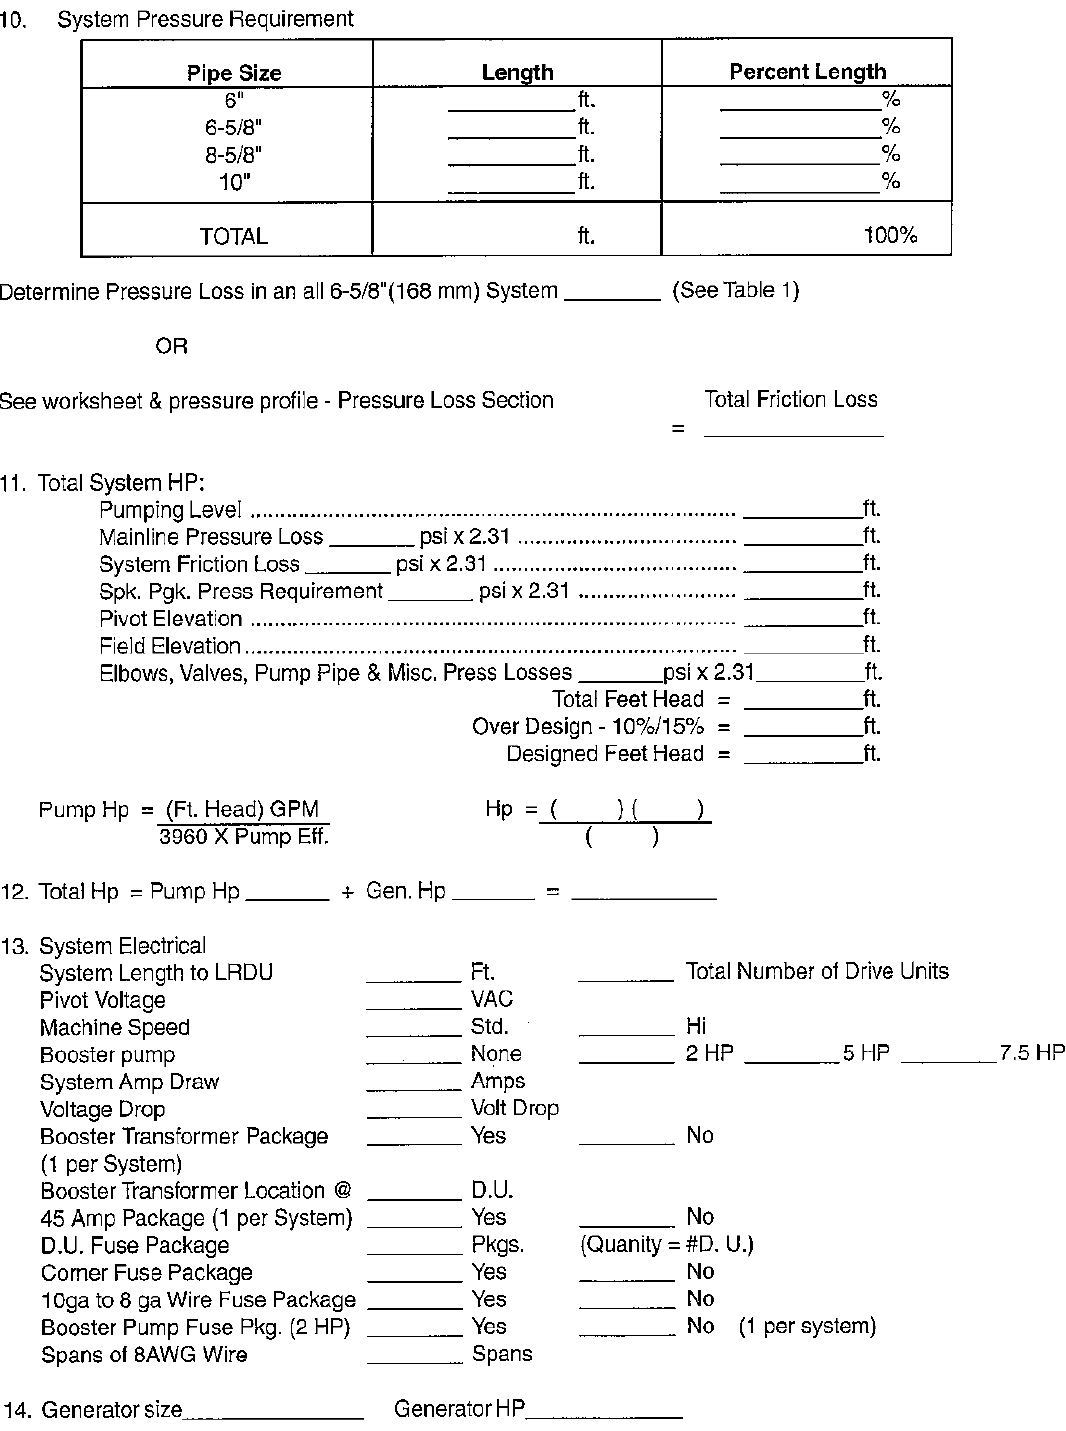
HECIPS design work sheet (United States Department of Agriculture- USDA).
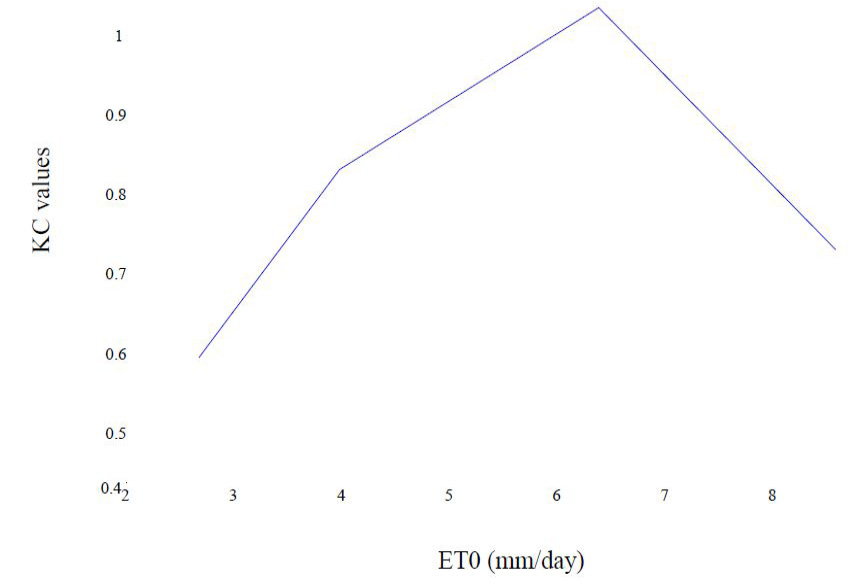
Chart between ETo and Kc values at different stages.
Chart between percent timer hours per revolution.
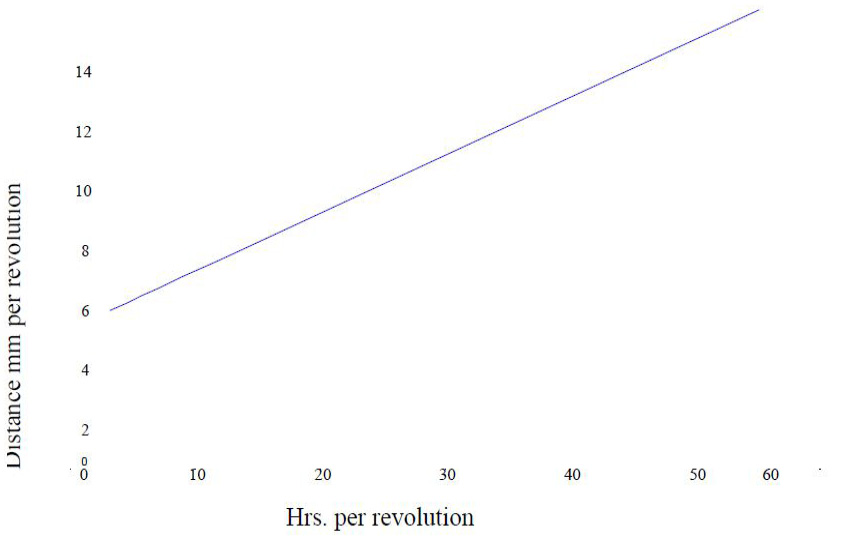
Chart between hours per revolution and distance mm per revolution.
Chart between total dynamic head and total pump horse power.
Chart between flow rate and total pump horse power


