

Blood Transcriptome Analysis Indicates Age-Associated Differences in Immune-Related Gene Expression in Captive South China Tigers (Panthera tigris amoynesis)


Blood Transcriptome Analysis Indicates Age-Associated Differences in Immune-Related Gene Expression in Captive South China Tigers (Panthera tigris amoynesis)
Qunxiu Liu1, Yingying Wang2 and Yaohua Yuan2*
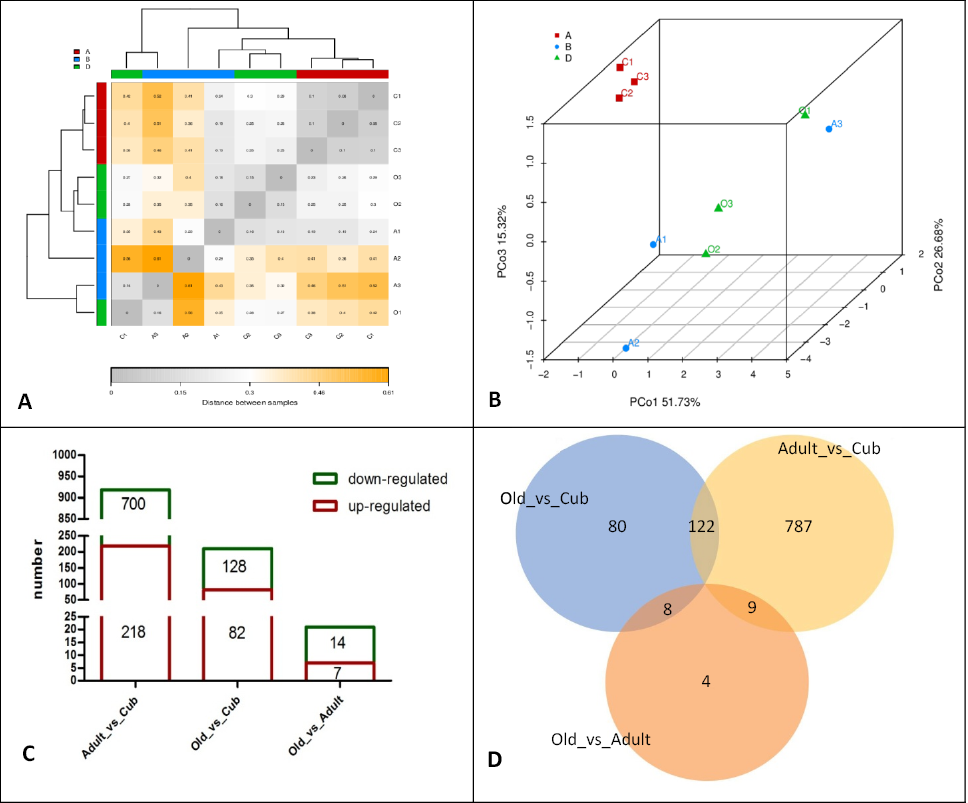
Fig. 1.
Profile of the blood transcriptome of SCT. (A) Distance heatmap of all samples based on gene TPM value. (B) PCoA of all samples based on TPM value. (C) Histogram of DEGs in each group (the red box represents up-regulated DEGs, and the green box represents down-regulated DEGs. (D) Venn diagram of the number of DEGs among 3 groups.
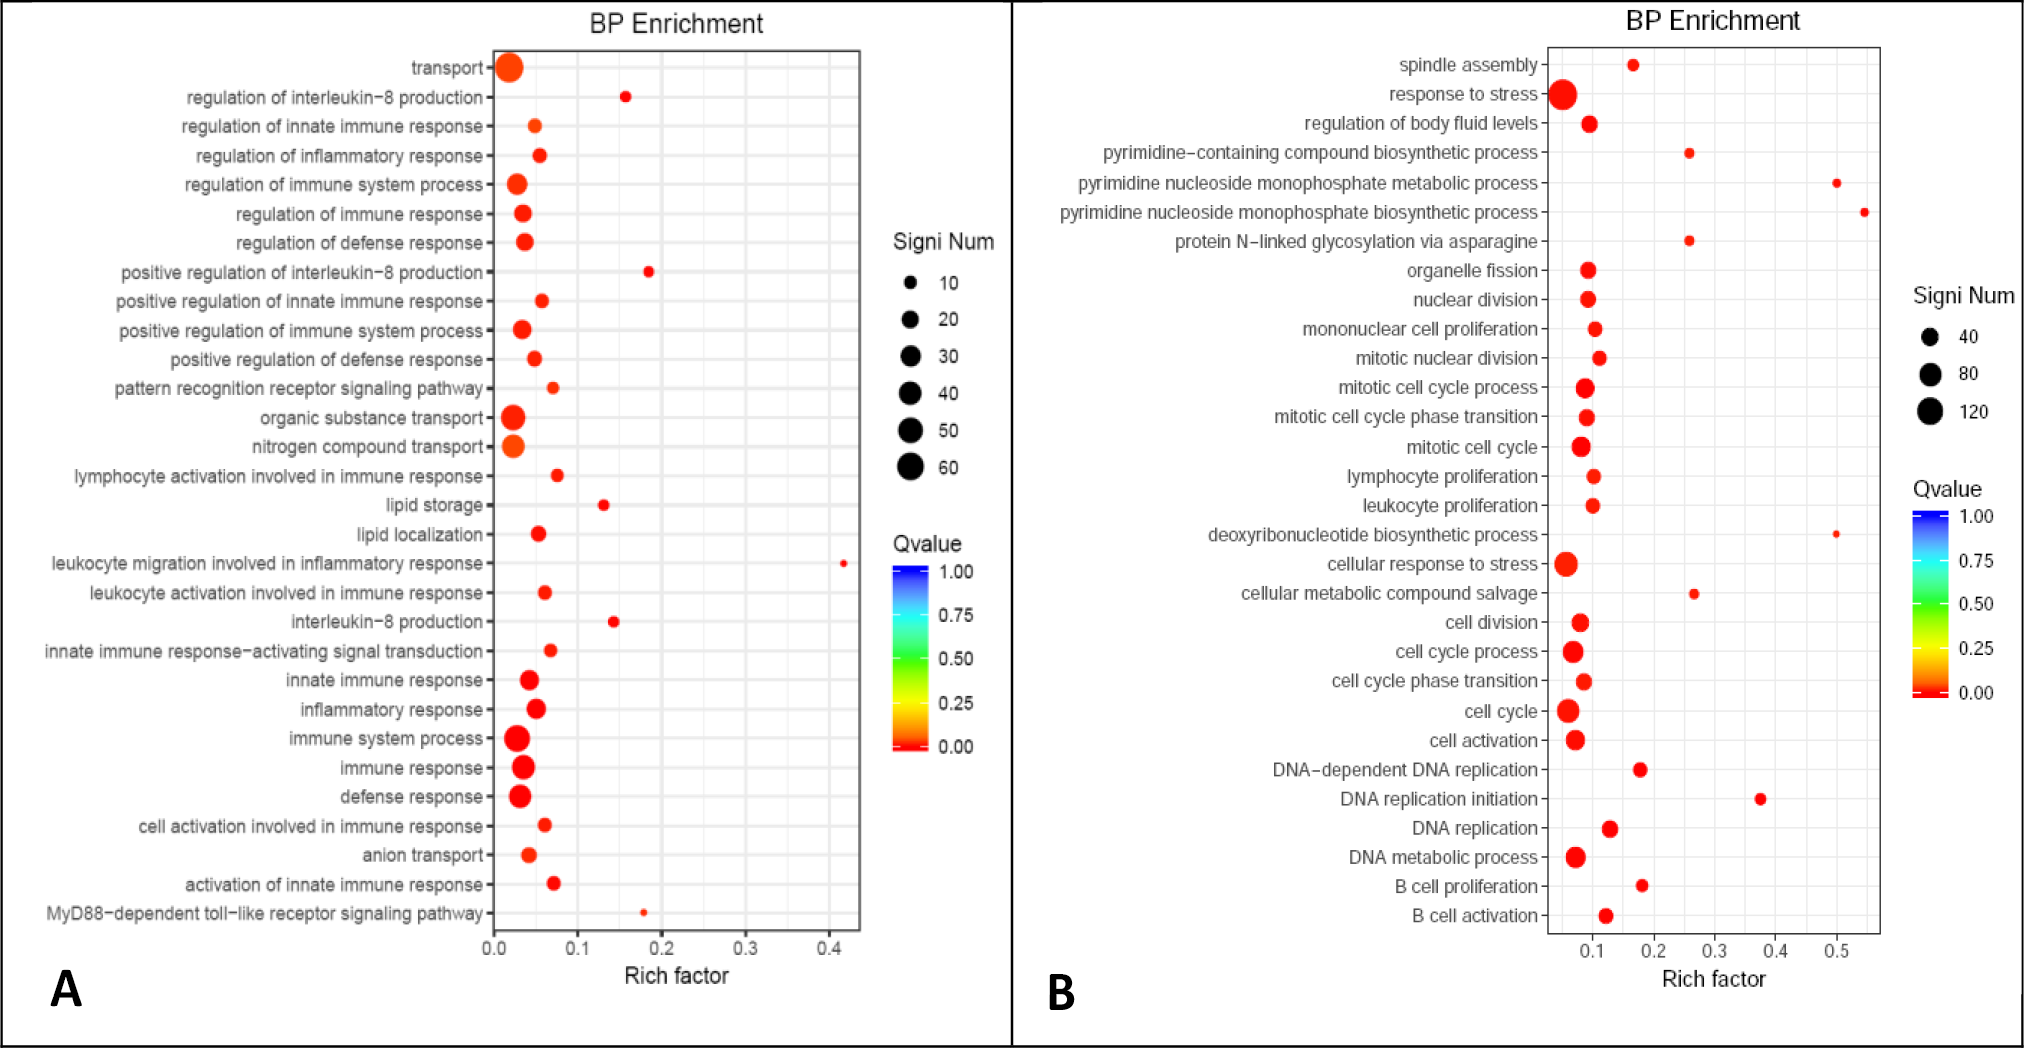
Fig. 2.
Enriched functions in BP category of GO annotation for up-regulated (A) and down-regulated (B) DEGs of adult SCTs as compared with cubs.
Notes: The Y-axis represents the function annotation information and the X-axis represents the Rich factor corresponding to the function (The number of DEGs annotated to the function divided by the total number of genes annotated to the function). The Qvalue is represented by the dot color (The closer the color to red, the smaller the Qvalue is). The number of DEGs included in each function is represented by the size of the dot.
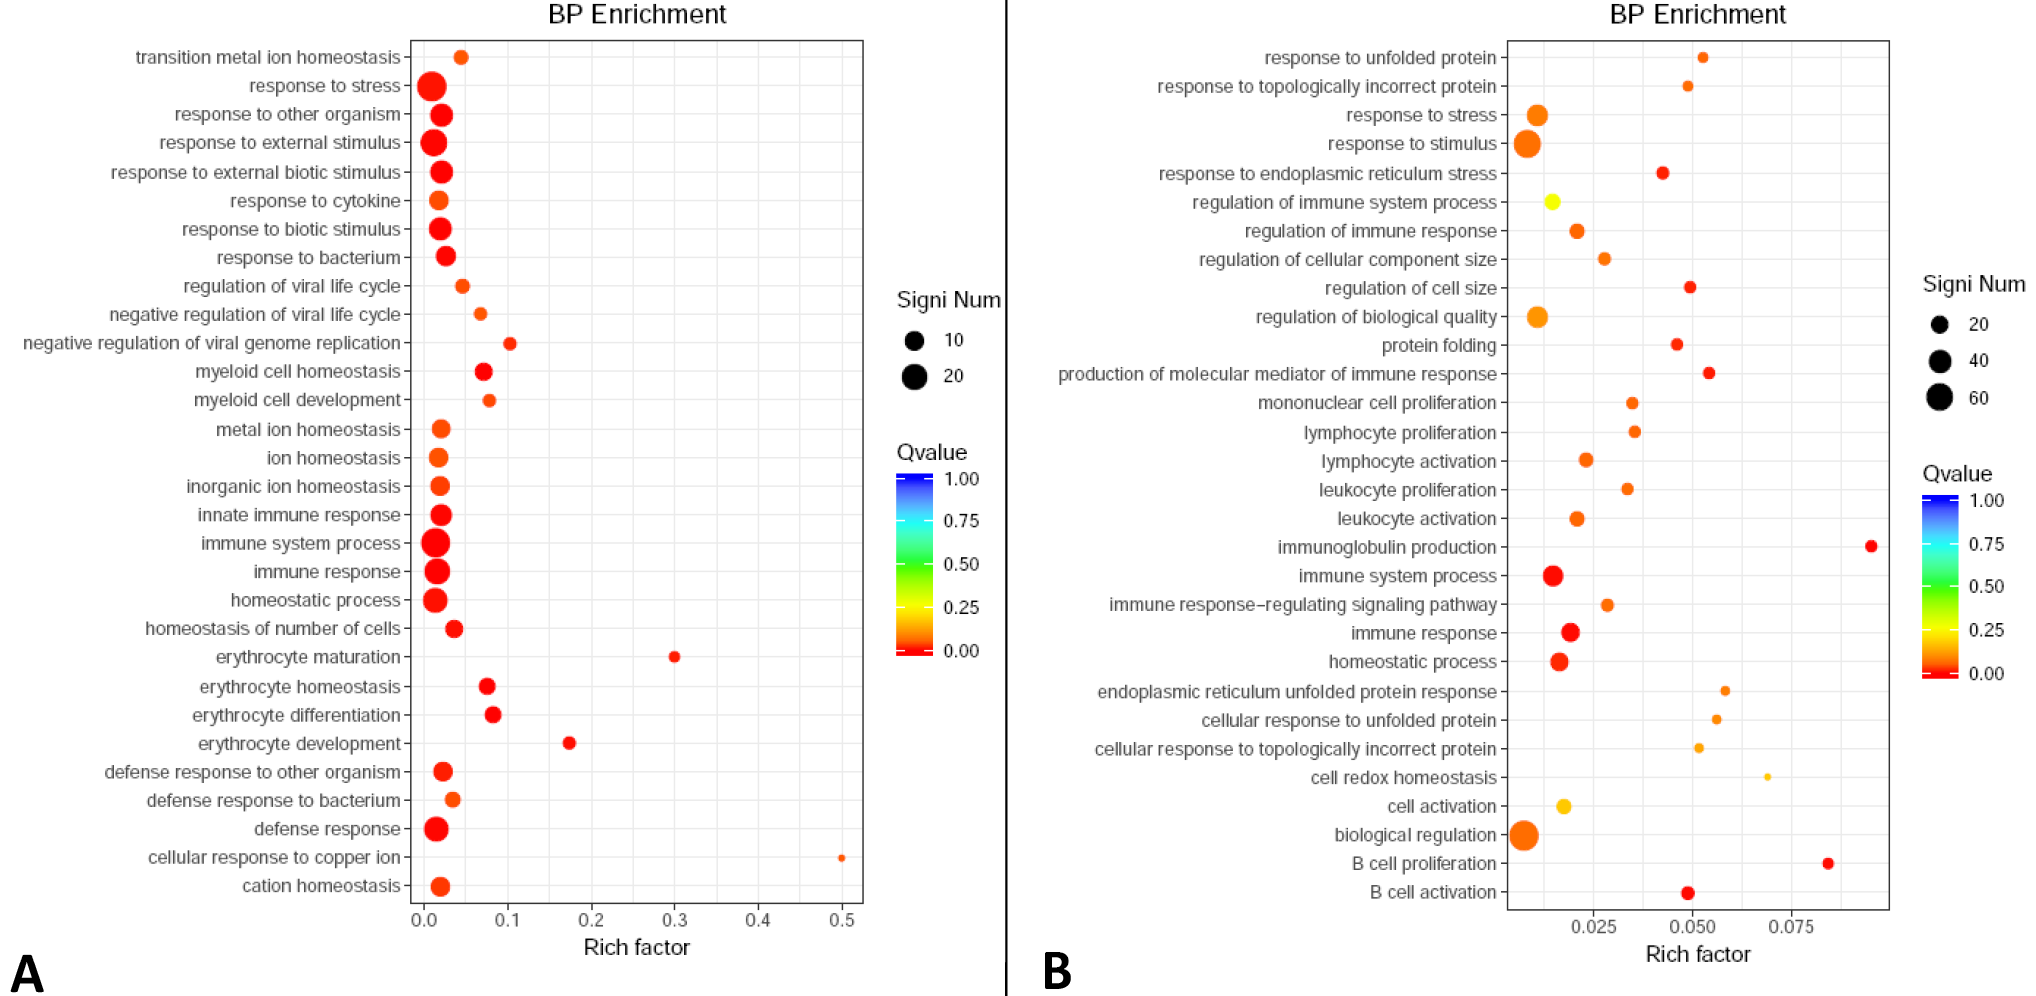
Fig. 3.
Enriched functions in BP category of GO annotation for up-regulated (A) and down-regulated (B) DEGs of old SCTs as compared with cubs.
For details of X-axis, Y-axis, Q value and DEGs, see Fig. 2.
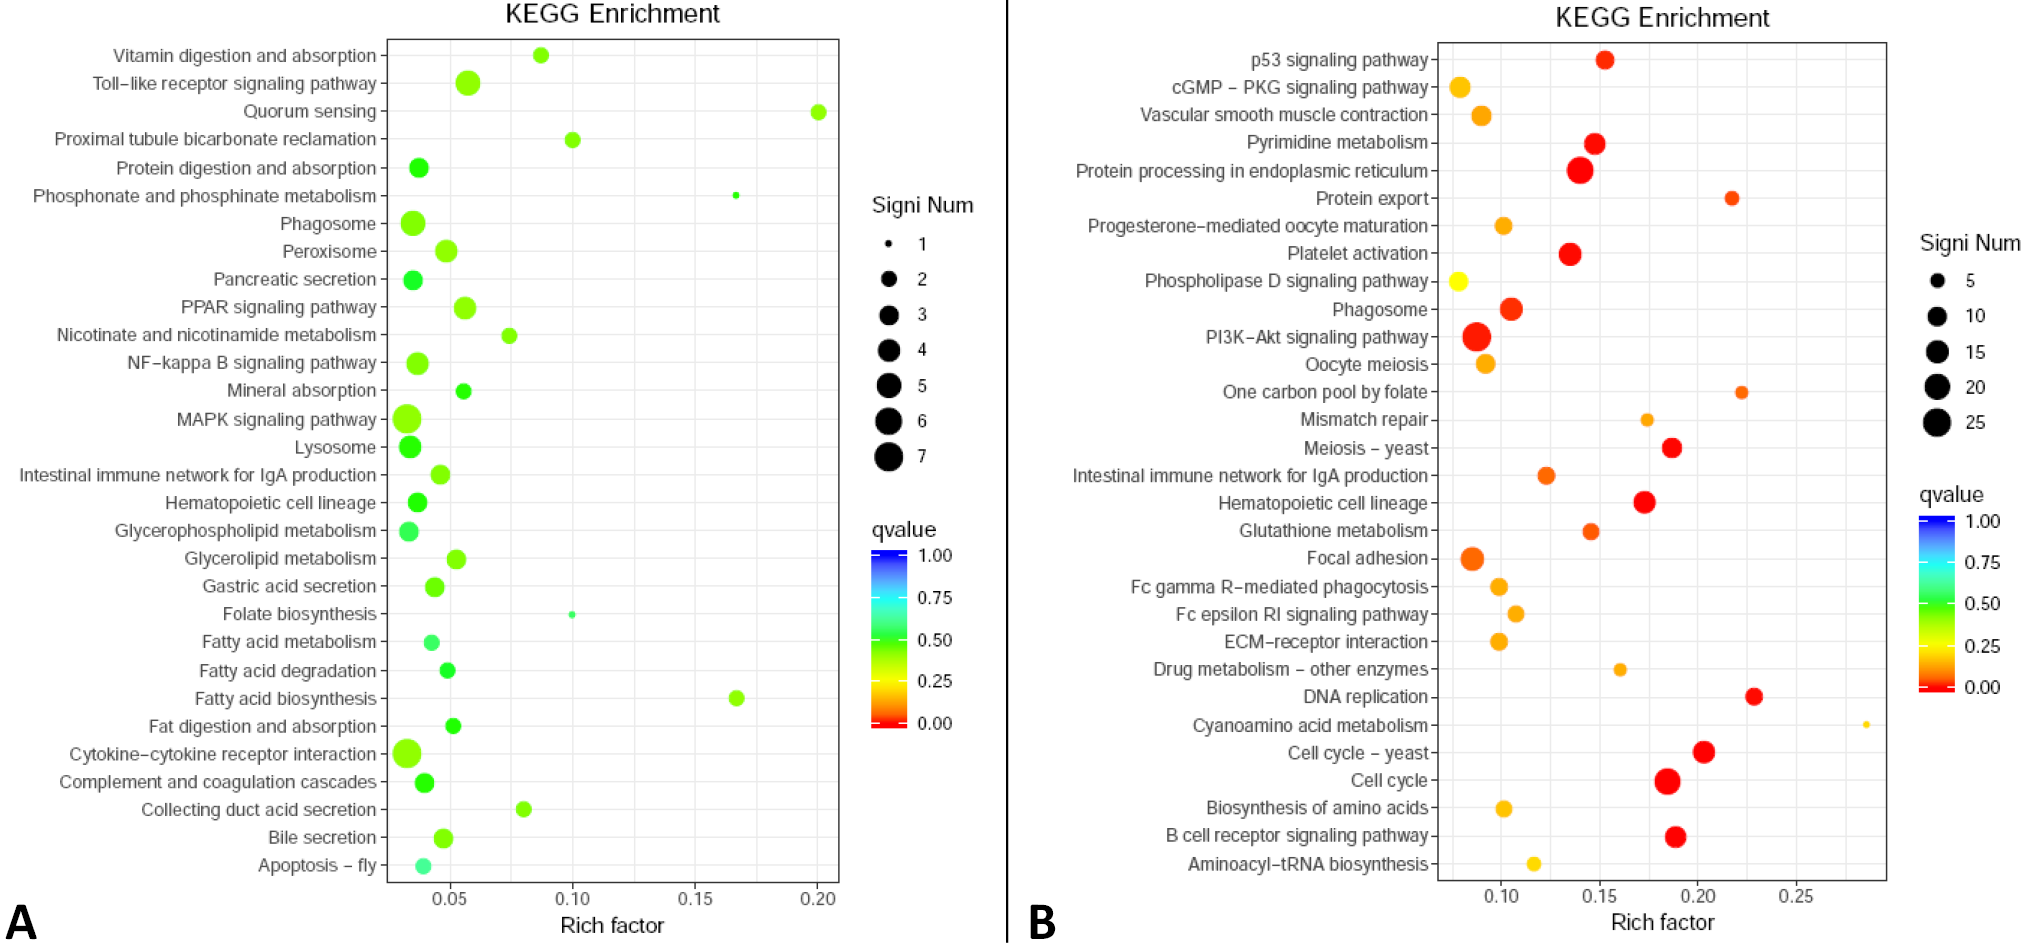
Fig. 4.
Enriched functions of KEGG annotation for up-regulated (A) and down-regulated DEGs in adult SCTs as compared with cubs.
For details of X-axis, Y-axis, Q value and DEGs, see Fig. 2.
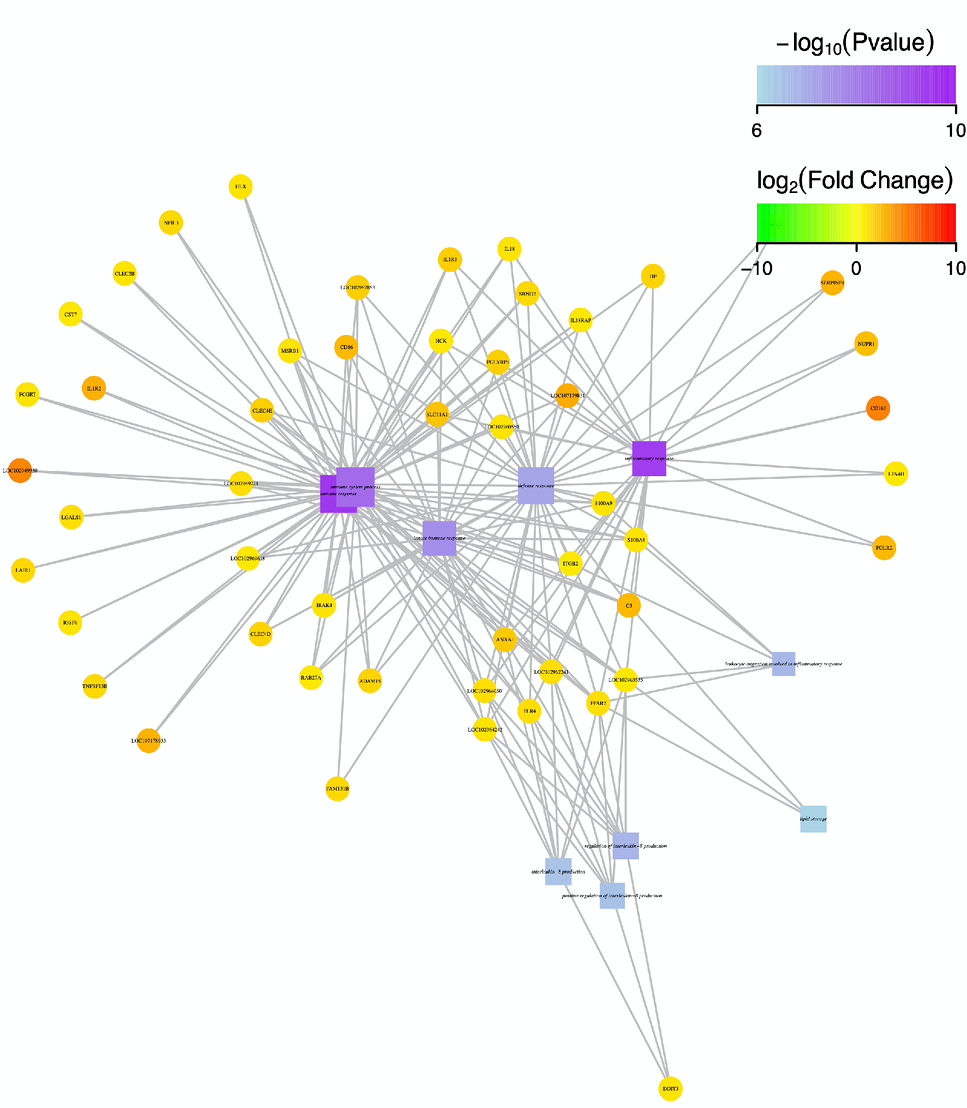
Fig. 5.
Function-gene interaction network diagram on the genes related with immune system/process.
Notes: In this figure, square nodes represent enriched functions, circular nodes represent genes, and edges represent the association between genes and functions. The size of the node is proportional to the connectivity (degree), that is, more edges connected to the node, the larger the node; the color of circular node represents the degree of difference in gene expression of samples (logFC value). Green represents down-regulation, red represents up-regulation, and the color depth represents the degree of difference in regulation. The color of the square node represents the enrichment degree of the function (the darker of square node means lower P value and higher enrichment degree). The larger the area of the square node, the more DEGs involved in it, and the greater the contribution to biological phenomena (Top 10 enriched functions and related gene were selected for mapping).
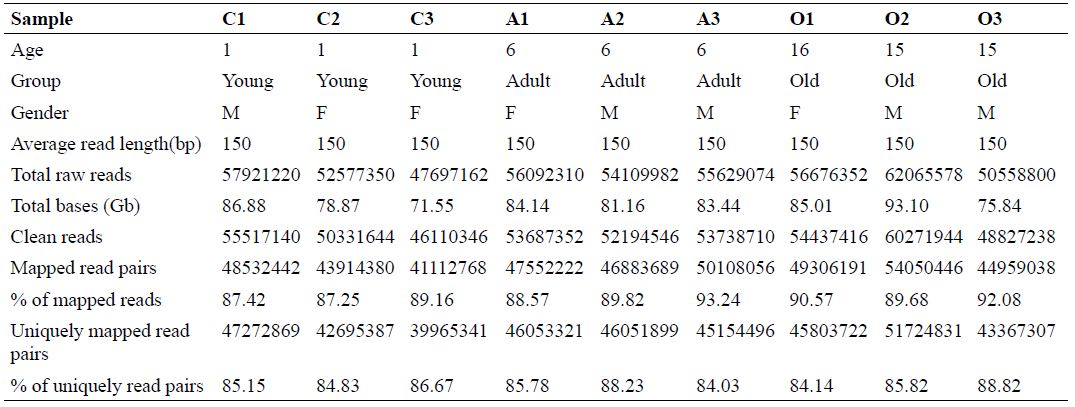
Table I.
Summary of sequencing of transcriptome of different blood samples.
C1, C2, C3, cub groups; A1, A2, A3, adult group; O1,O2, O3, old group.


