

Carvacrol Induces Doxorubicin-Resistant Breast Cancer Cell Apoptosis via Inhibition of the PI3K/Akt Pathway


Carvacrol Induces Doxorubicin-Resistant Breast Cancer Cell Apoptosis via Inhibition of the PI3K/Akt Pathway
Hu-Hu Chen1,2*, Jiao-han Zhou3 and Siat Yee Fong2,4
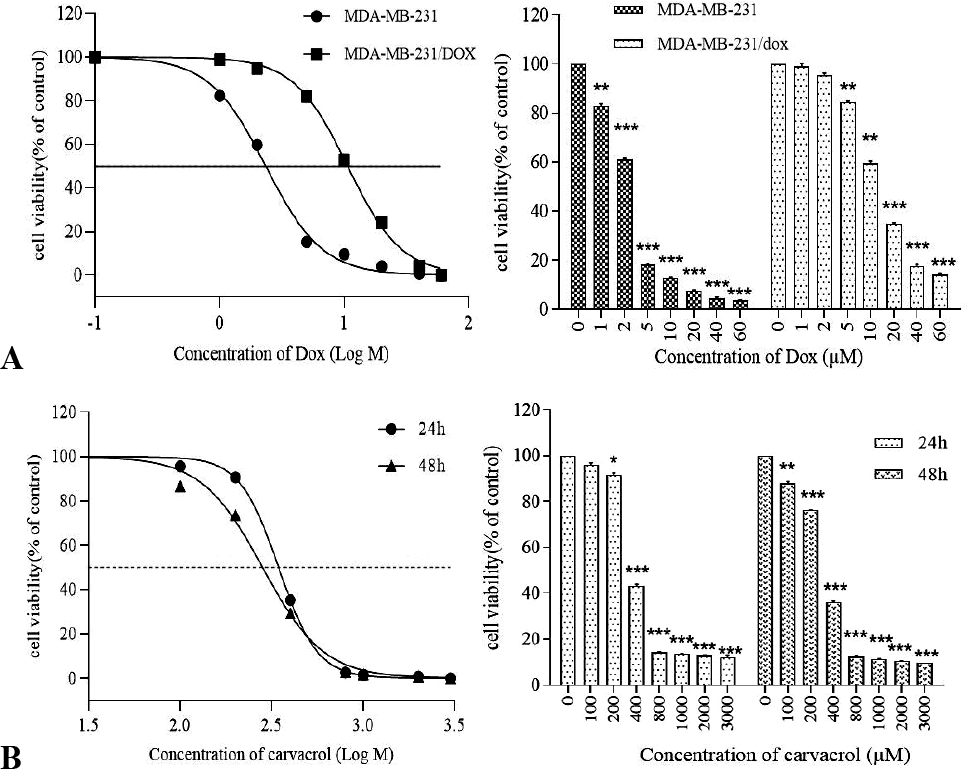
(A) Dose response curve of MDA-MB-231 and MDA-MB-231/Dox cells to Dox. (B) Carvacrol inhibits the proliferation of MDA-MB-231/Dox cells as measured by CCK-8 assay. P-values of p < 0.05, p < 0.01, and p < 0.001 are indicated with (*), (**), and (***) vs. black control, respectively. Plotted values are means ± SD (n = 3), each one in triplicate.
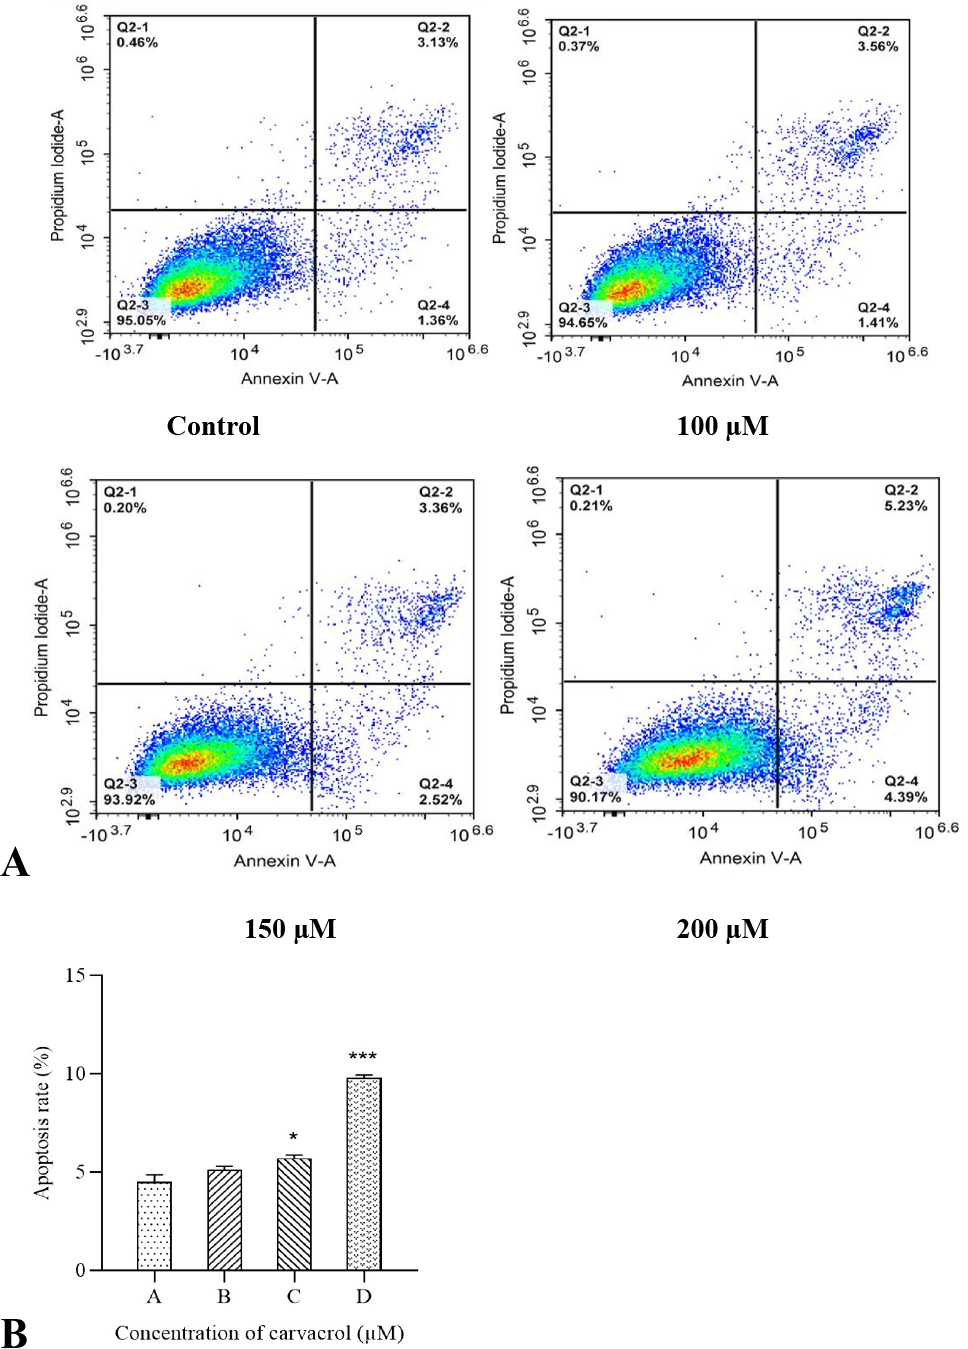
Effect of carvacrol on MDA-MB-231/Dox cell apoptosis. Cells were exposed to 0, 100, 150 or 200 µM carvacrol for 24 h. Values were presented as mean ± SD, symbol asterisk indicates significant (* p < 0.05, *** p< 0.001) difference as compared to the control cells. V-viable cells; A-apoptotic cells; D-dead cells.
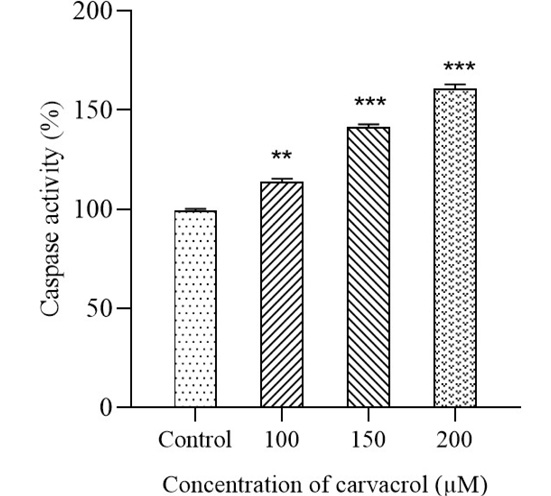
Dose-dependent activation of caspase-3 in carvacrol-treated MDA-MB-231/Dox cells. Caspase-3 activity percentage in MDA-MB-231/Dox cells treated with different concentrations of carvacrol for 24 h was determined by caspase-3 activity assay. Values are presented as mean ± SD, and symbol asterisk indicates significant (** p < 0.01, *** p < 0.001) difference as compared to the control cells.
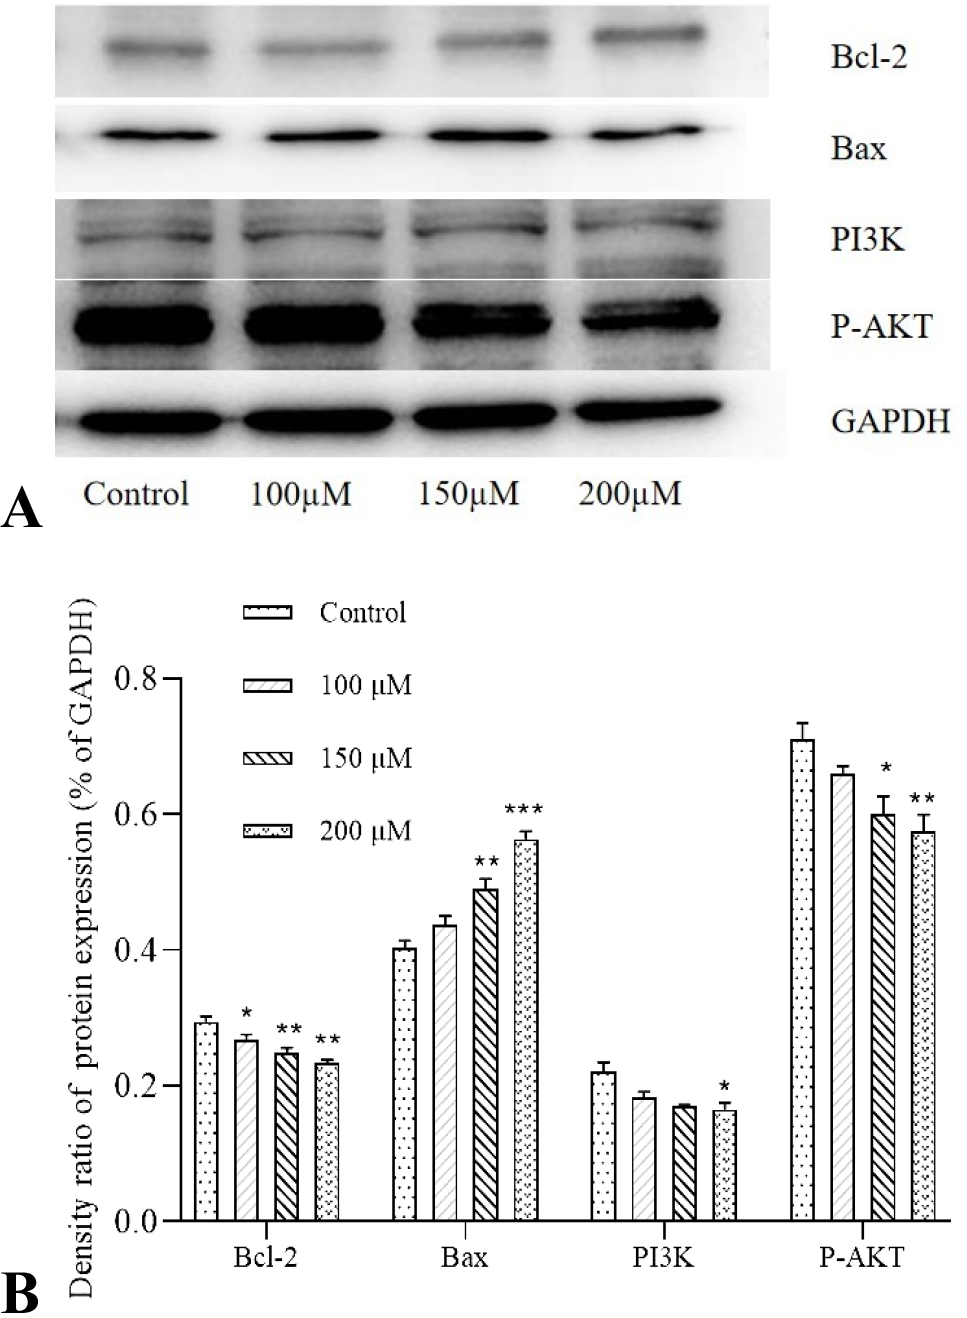
Effect of carvacrol on apoptosis-related protein expressions by Western blotting. GAPDH was used as a loading control. Values are presented as mean ± SD, and symbol asterisk indicates significant (* p < 0.05, ** p < 0.01, *** p < 0.001) difference as compared to the control cells.


