

Descriptive Analysis of Water Resources in Pakistan: A Perspective of Climate Change
Ateeq Ahmad1, Umar Hayat2, Shahid Ali2*, Hazrat Bilal3, Naveed Ali2, Khan Mir Khan4 and Khalid Khan4
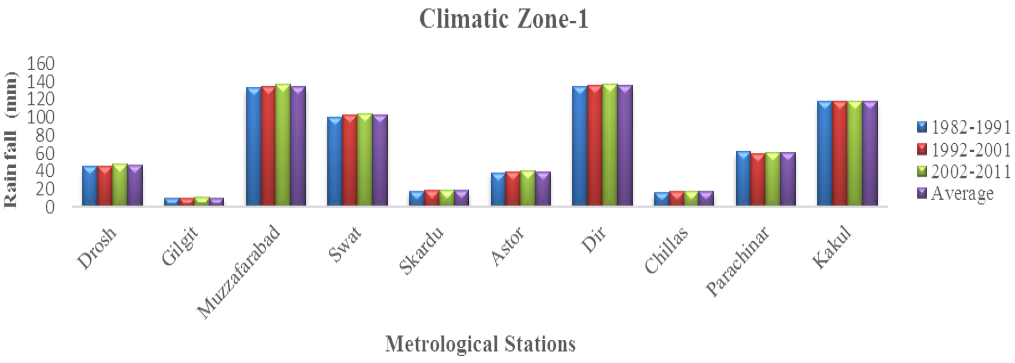
Figure 1:
Graph showing 30 years mean annual rainfall of zone 1.
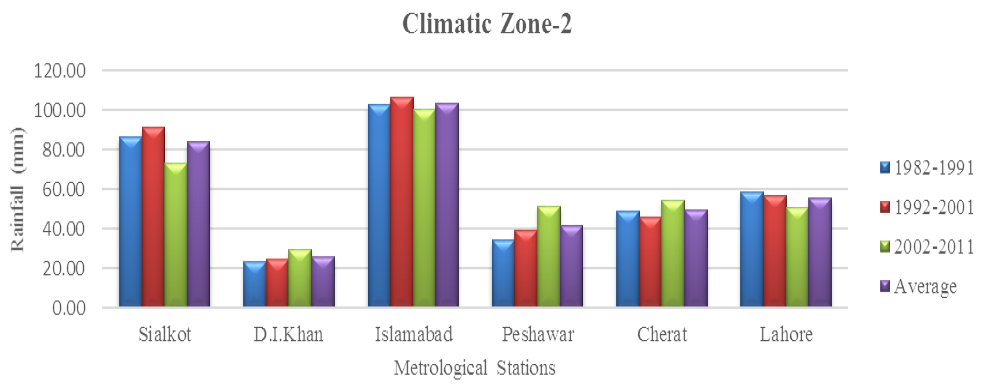
Figure 2:
Graph showing 30 years mean annual rainfall of zone 2.
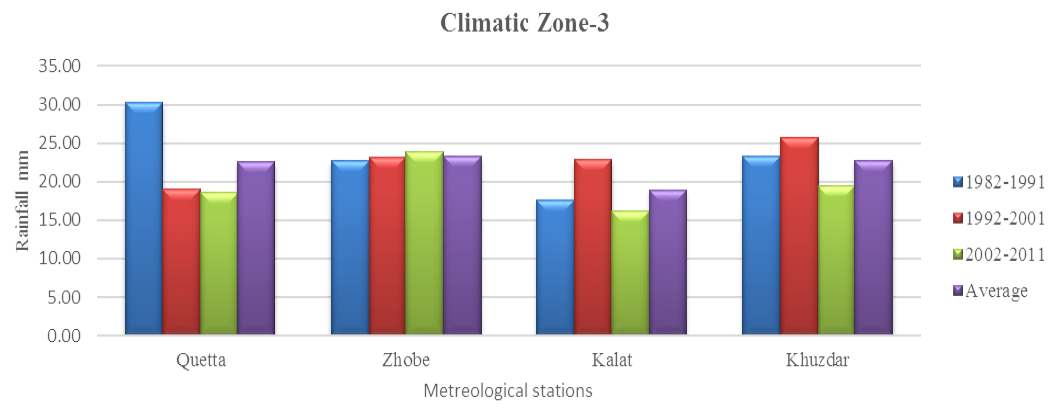
Figure 3:
Showing 30 years mean annual rainfall for Zone 3.
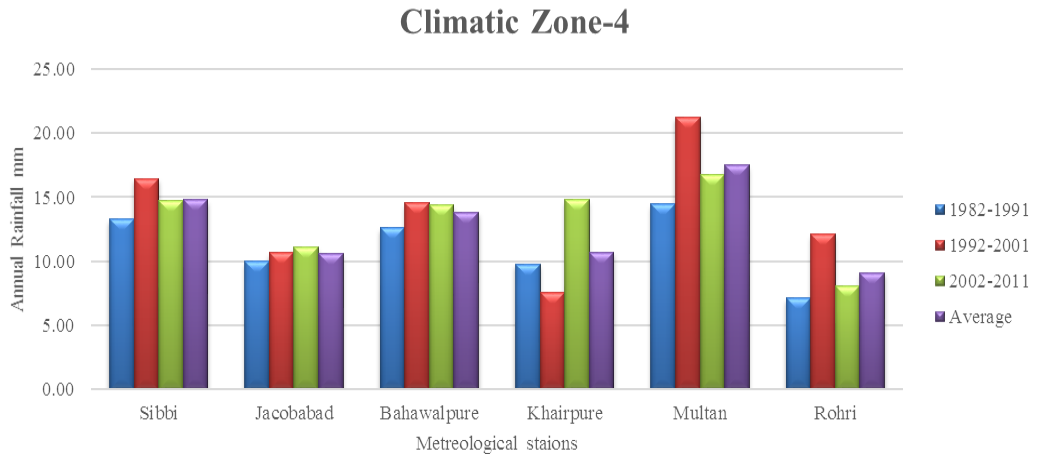
Figure 4:
Showing 30 years mean annual rainfall for Zone 4.
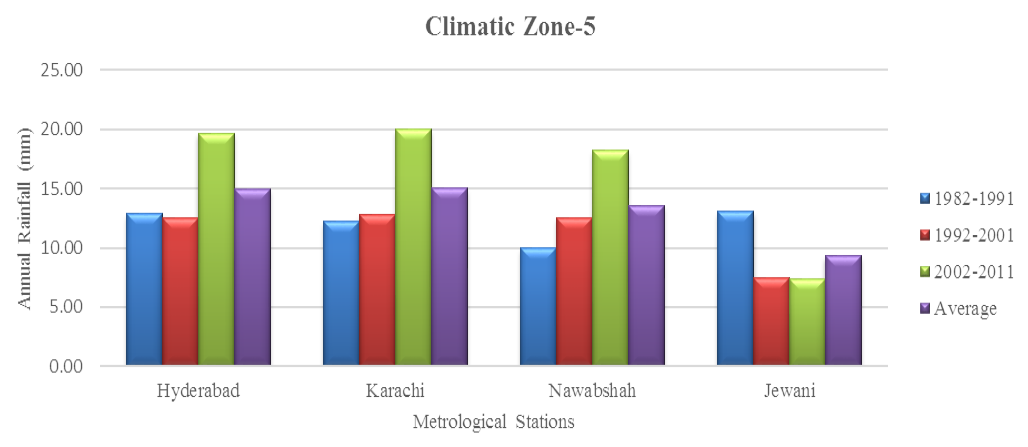
Figure 5:
Showing 30 years mean annual rainfall trend for Zone 5.
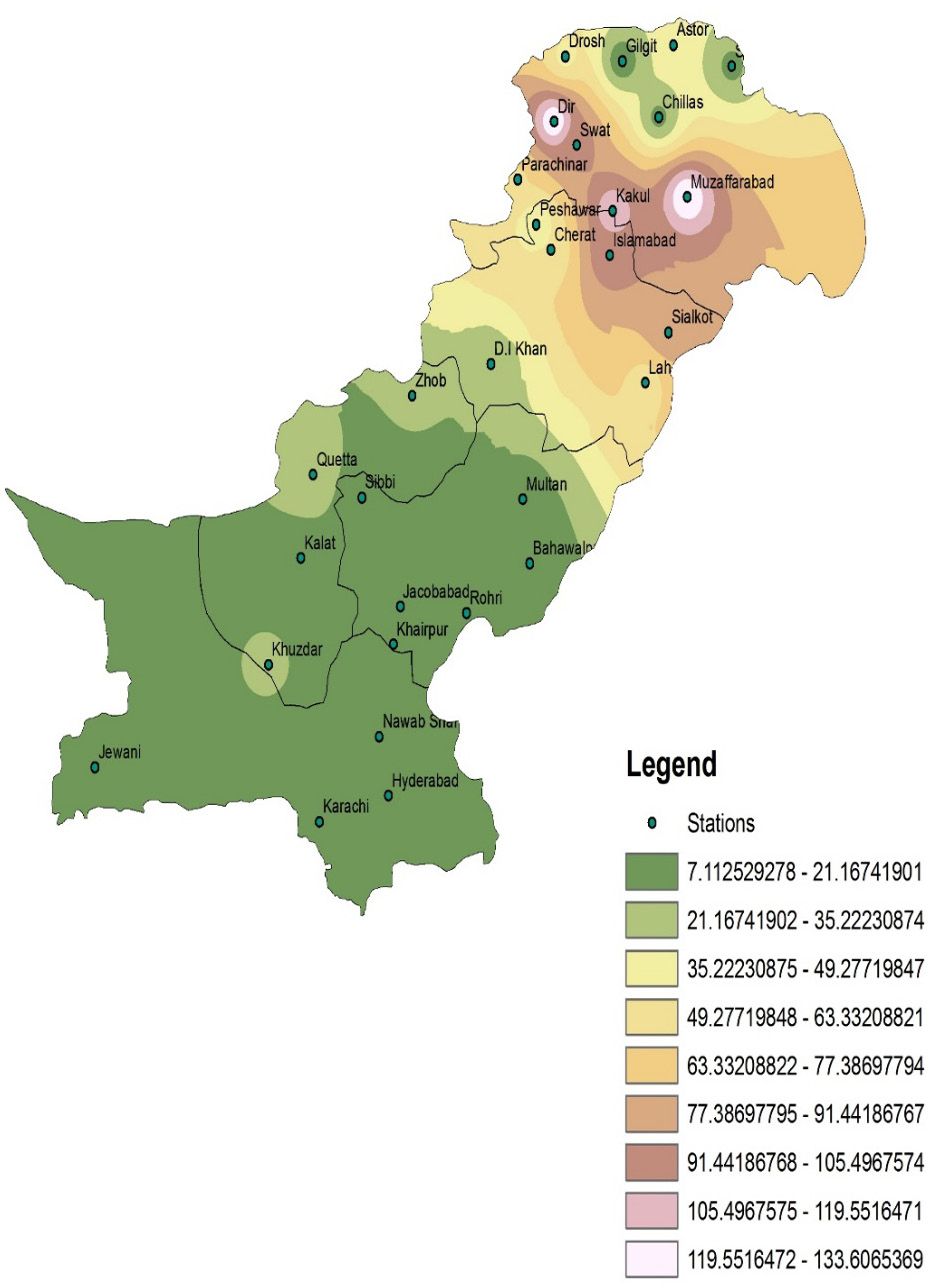
Figure 6a:
Showing the average rainfall for all stations from 1982 – 1991.
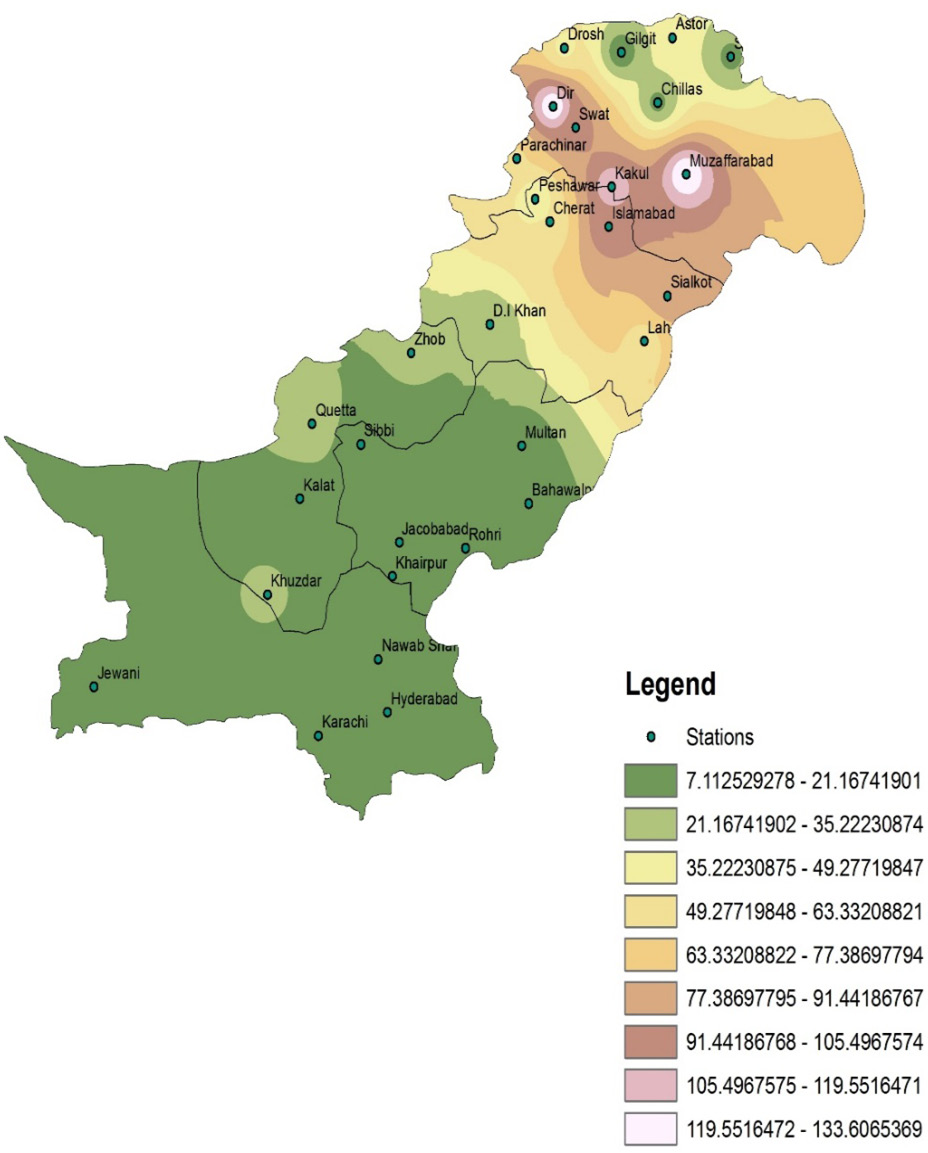
Figure 6b:
Average rainfall for all stations from 1992–2001.
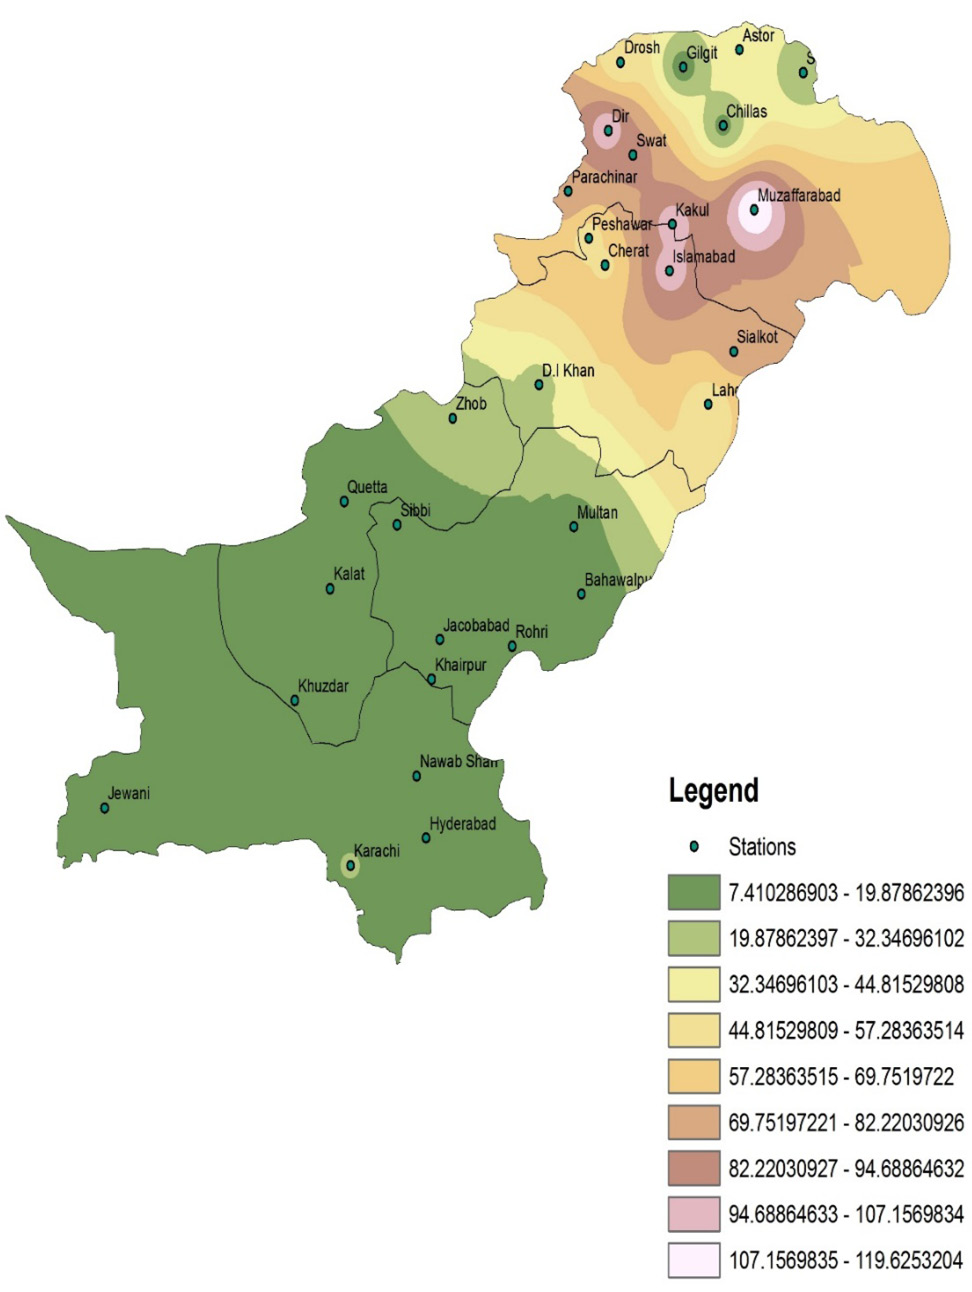
Figure 6c:
Average rainfall for all stations from 2002 – 2011.
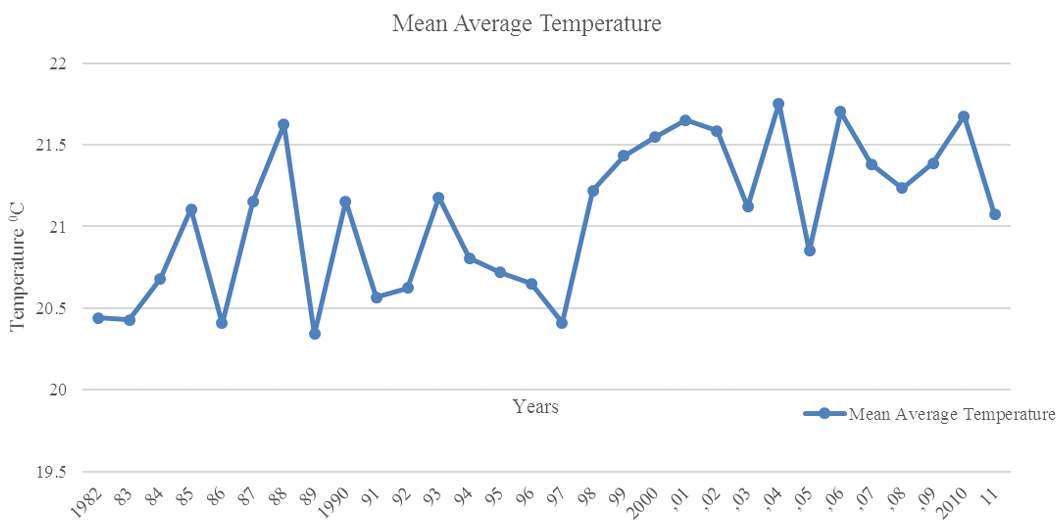
Figure 7:
Mean annual temperature trend for 30 years 1982-2011.
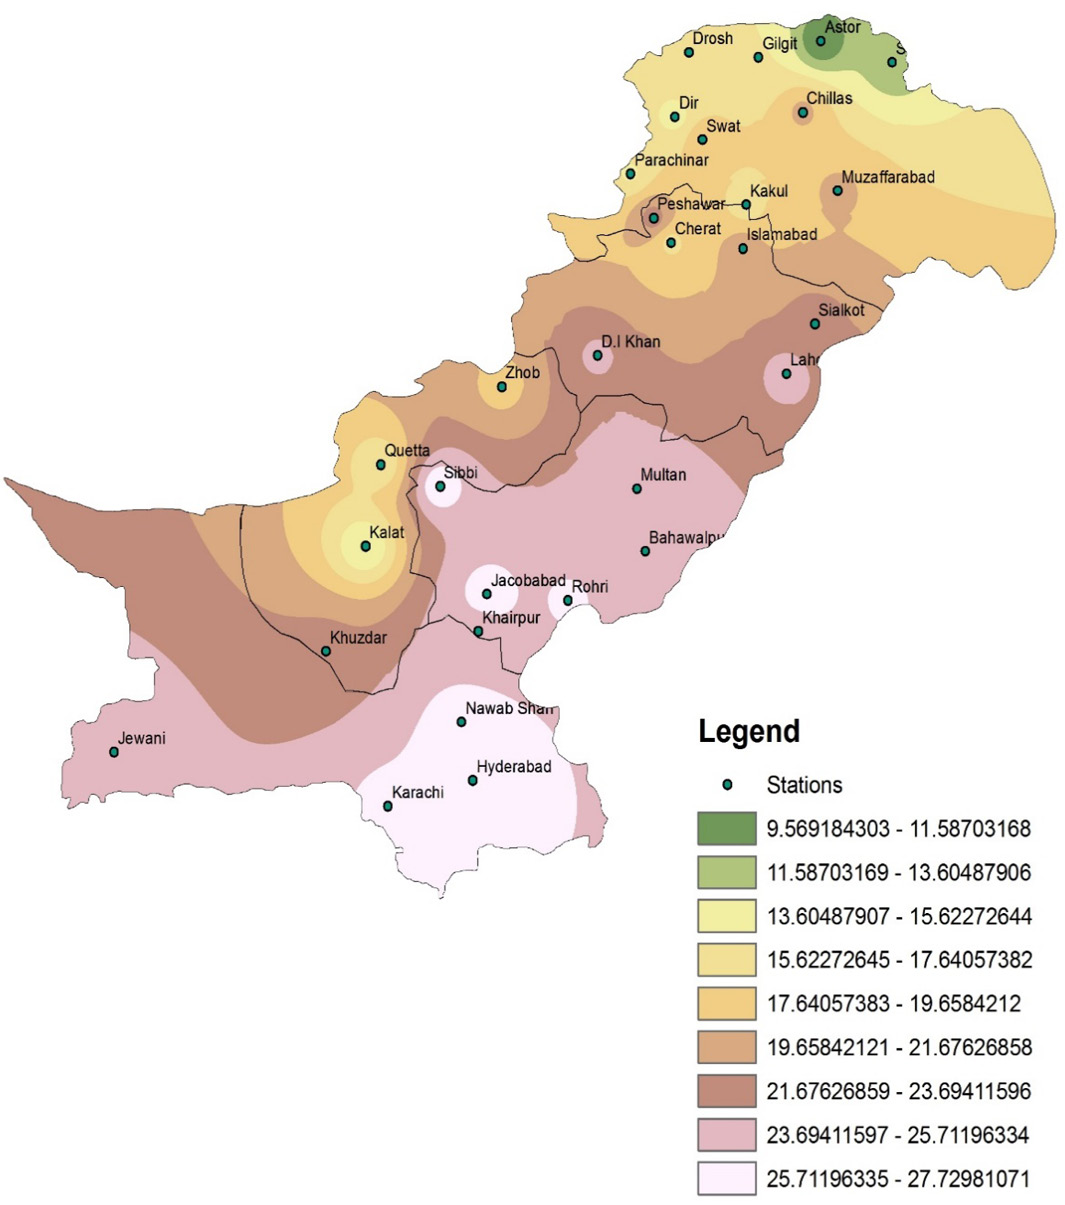
Figure 8a:
Average temperature for all stations from 1982 – 1991.

Figure 8b:
Average temperature for all stations from 1992 – 2001.
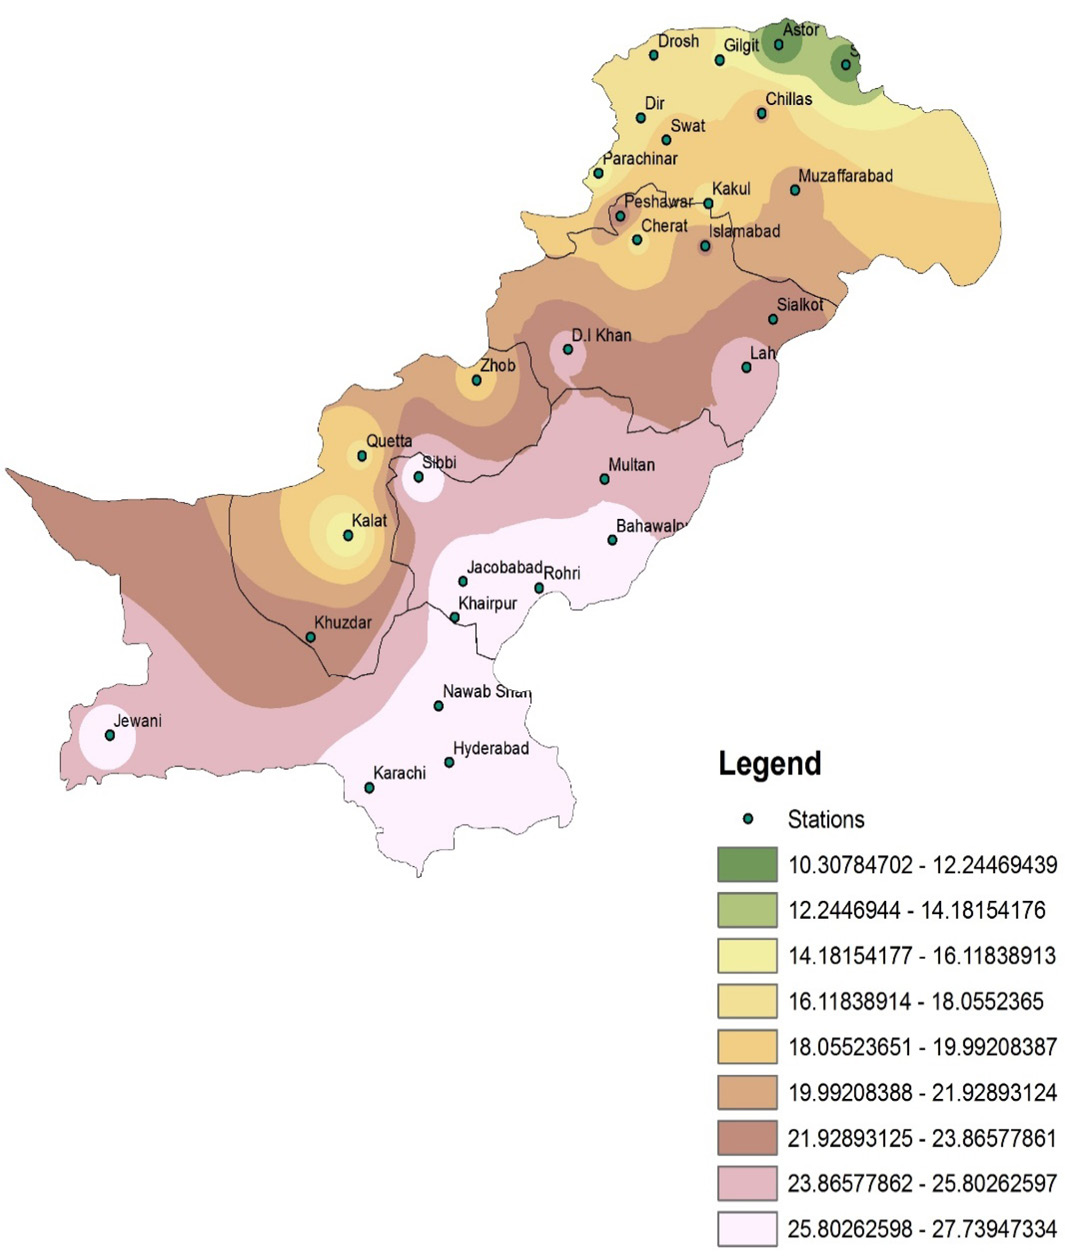
Figure 8c:
Average temperature for all stations from 2002 – 2011.

December 2020
Vol. 6, Iss. 2, Pages 77-235

