Forages Growth and Yield Response in Crops Mixture and Pure Stands under Conventional Vs Conservation Tillage in Rainfed
Forages Growth and Yield Response in Crops Mixture and Pure Stands under Conventional Vs Conservation Tillage in Rainfed
Muhammad Rasheed1*, Zafar Ullah1, Muhammad Ansar1, Asma Hassan1, Shahzada Sohail Ijaz2, Muhammad Hussain Shah4 and Muhammad Arshadullah3
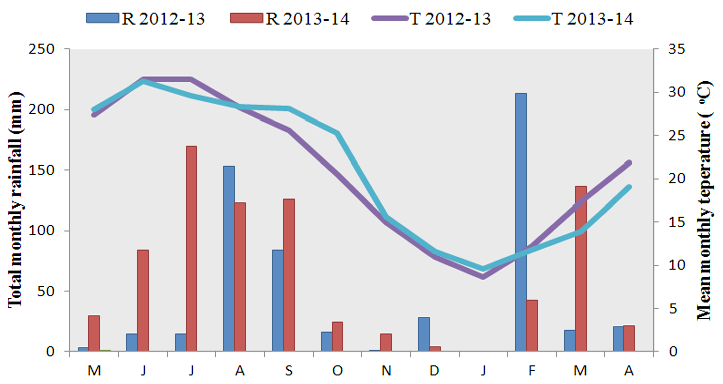
Total monthly rainfall (mm) and mean monthly temperature (0C) during study period.
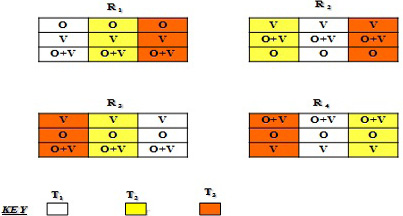
The experiment lay out; Where, O= oats pure stand; O+V= oats-vetch mixture; V= vetch pure stand; R1= first replication; R2= second replication; R3= third replication; R4= fourth replication; T1= zero tillage; T2= minimum tillage (one tillage with moldboard plough and four ploughings with cultivator) and T3= conventional tillage (one tillage with moldboard plough and six ploughings with cultivator).
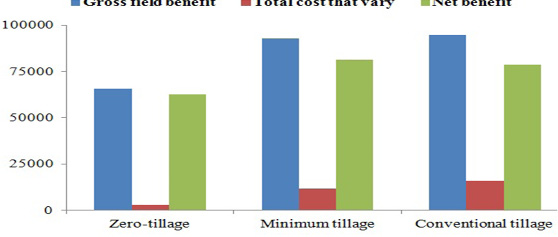
The economic parameter used in dominance analyses for oats.
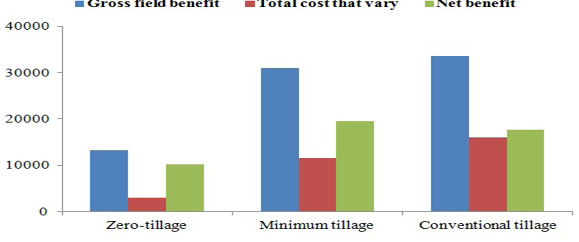
The economic parameters used in dominance analyses for vetch.
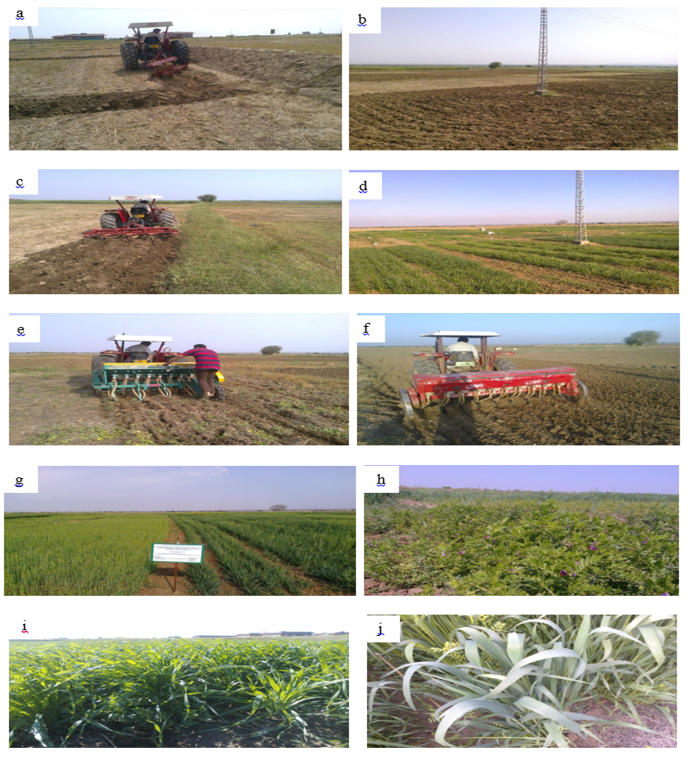
a) cultivation with mould board plough. B) zero-till plots. c) Cultivation with cultivator. d) Early stage of crops. e) Sowing with zero-till drill. f) Sowing with wheat seed drill. g) Experimental field. h) Vetch at flowering stage. i) oat at booting stage. j) Oat-vetch mixture.


