Submit or Track your Manuscript LOG-IN

Forecasting the Fisheries Production in Pakistan for the Year 2017-2026, using Box-Jenkin’s Methodology

Forecasting the Fisheries Production in Pakistan for the Year 2017-2026, using Box-Jenkin’s Methodology

Qaisar Mehmood1*, Maqbool Hussain Sial1, Saira Sharif1, Abid Hussain2, Muhammad Riaz3 and Nargis Shaheen4 

1Government Post Graduate College Bahawalnagar, PhD Scholar at Department of Quantitative Methods, University of Management and Technology Lahore. 2Department of Economics, National College of Business Administration and Economics Lahore, Pakistan. 3Department of Statistics, Raheem Yar Khan Campus Islamia University, Bahawalpur, Pakistan. 4Department of Statistics, Govt. Girls College Bahawalnagar.

[email protected]  

Figure 1

Time plot of the fisheries production. 

Figure 2

ACF plot for fisheries production. 

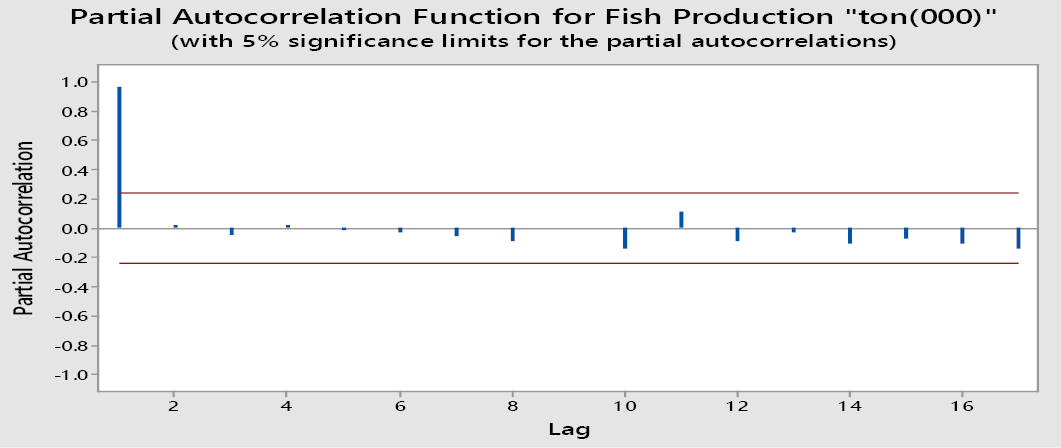
Figure 3

PACF plot of the fisheries production. 

Figure 4

Plot of the first difference of production. 

Figure 5

ACF plot of the first difference production. 

Figure 6

PACF plot of the first difference production. 

Figure 7

Plot of ACF of residual for production. 

Figure 8

Plot of PACF of residual for production. 

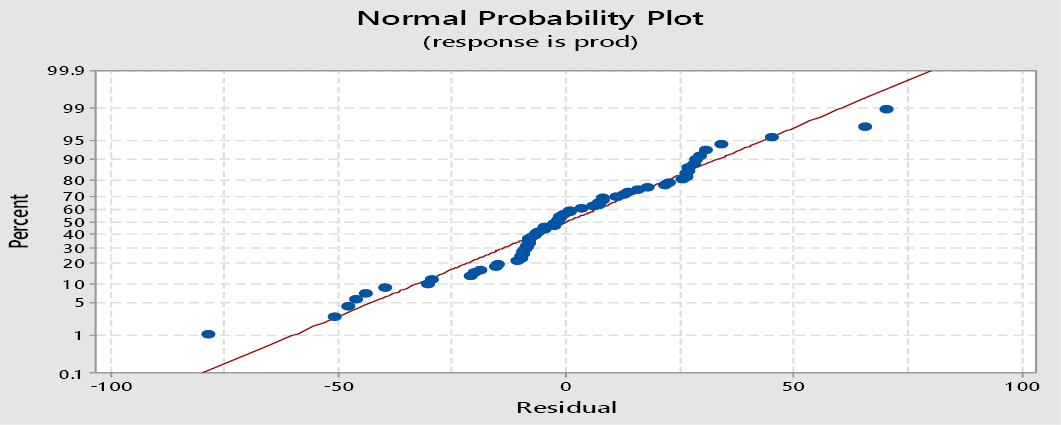
Figure 9

Residuals normal probability plot. 

Figure 10

Time plot fisheries forecast production for year 2017-2026. 

Eq1
Eq2
Eq3
Eq4
Eq5
Eq6
Eq7
Eq8

Pakistan Journal of Agricultural Research

September

Vol.37, Iss. 3, Pages 190-319

Featuring

Click here for more

Subscribe Today

Receive free updates on new articles, opportunities and benefits


Subscribe Unsubscribe