Genetic Diversity and Population Genetics of Cuttlefish Sepiella japonica based on Newly Developed SSR Markers
Genetic Diversity and Population Genetics of Cuttlefish Sepiella japonica based on Newly Developed SSR Markers
Yingying Ye1, Chengrui Yan1, Kaida Xu2, Jiji Li1, Jing Miao1, Zhenming Lü1 and Baoying Guo1*
Map showing the locations of five Sepiella japonica populations in five geographical positions and distributed in four provinces (three from the sea areas) along the coast of China (adapted from Li et al., 2014). The number behind of name of sampling sites means the number of sampling individuals.
Mean Ln likelihood values (LnP(K)), generated by STRUCTURE program, for each K putative genetic cluster for cuttlefish collected from the China Sea area based on 8 microsatellite loci.
Bayesian inference of population structure in Sepiella japonica populations at K= 2 as determined by STRUCTURE and population codes are as in Fig. 1.
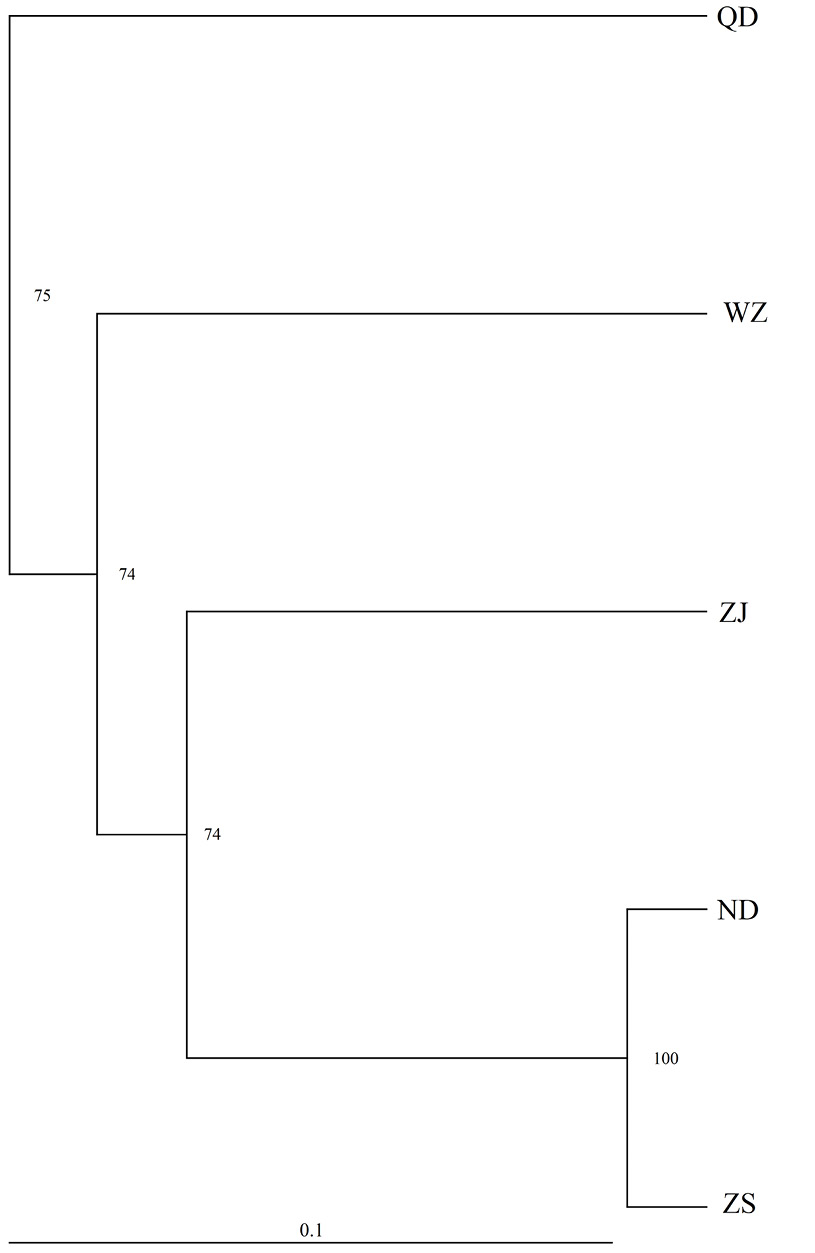
Neighbour-joining clustering of samples based on DC, percentage at node was a bootstrap value obtained from 1000 replicates and population codes are as in Fig. 1.
Main genetic variability measures by microsatellite locus of S. japonica from Wenzhou population.


