
Identification of Precipitation Zones within Indus River Basin (Pakistan) by Global Wavelet Power Spectra

Identification of Precipitation Zones within Indus River Basin (Pakistan) by Global Wavelet Power Spectra
Kamran Zakaria1*, Noreen Munawar1 and Shafqat Ejaz2
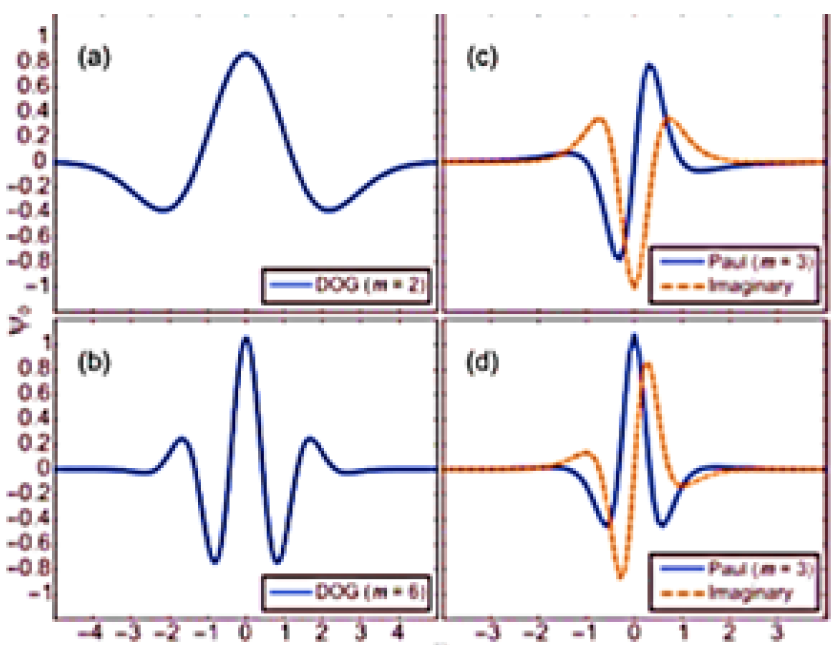
Mother wavelets of: (a) Derivative of Gaussian (DOG) with m = 2; (b) DOG with m = 6; (c) Paul with m = 3 and (d) Paul with m = 4. Paul mother wavelets include the imaginary part.

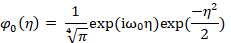
Example of the morlet mother wavelet including the imaginary part. Main plot: Morlet mother wavelet with ω0=6. Inset: Morlet mother wavelet with ω0=2.

(a) Monthly rainfall for the 1961-2016 period; (b): The wavelet power spectrum using Morlet mother wavelet. Here thick contour encloses regions of greater than 95% confidence for a red-noise process; (c): The global wavelet power spectrum. The dashed line is the 5% significance level, using a red-noise background spectrum; (d): showsscale-average wavelet power for 8- to 16- month bandand 5% significance level is indicated by a dashed line, supposing red noise.

Global wavelet power spectrum: (a) Pattern A, characterized by only one frequency (annual), and (b) Pattern B, characterized by more than one frequency.

Global wavelet power spectra: (a), (b) and (c) classified as frequency Pattern A, characterized by one main frequency, at the 8- to 16-month band; and (d), (e) and (f) classified as frequency Pattern B.

Three regions in Pakistan indicating Pattern (A, B and Transition zone) of the global wavelet power spectra over river Indus.


