
Organic Amendments Increase the Growth, Resistance and Management of the Root-Knot Nematode, Meloidogyne arenaria in Arachis hypogaea L.

Organic Amendments Increase the Growth, Resistance and Management of the Root-Knot Nematode, Meloidogyne arenaria in Arachis hypogaea L.
Eman Abdelrazik1, Sahar H. Abdel-Baset2*, Abdelghafar M. Abu-Elsaoud3,4 and Shimaa M.A. Mohamed5
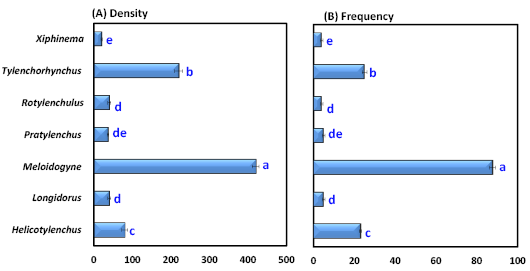
(A) Population density and (B) frequency of occurrence (%) of plant-parasitic nematode genera associated with peanuts in Ismailia Governorate during the 2021-2022 growing seasons. Bars followed by different values are significantly different according to the DMRT.
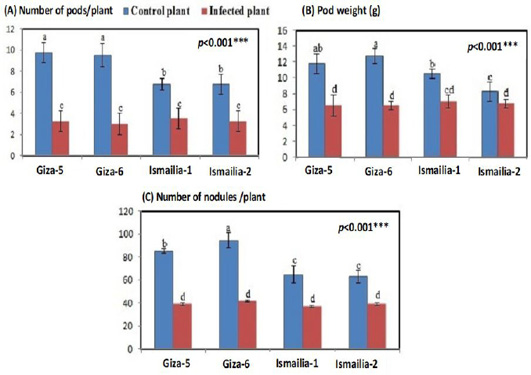
Number of pods per plant, pod weight and number of nodules per plant of different peanut cultivars (Giza 5, Giza 6, Ismailia 1 and Ismailia 2) infected with Meloidogyne arenaria. Bars with different letters are significantly different according to the DMRT.
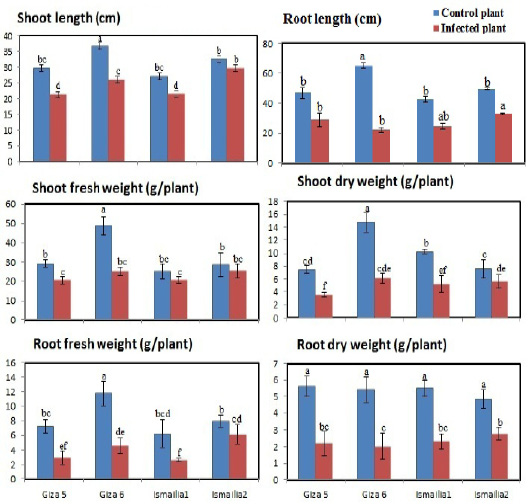
Shoot length, root length, shoot fresh weight, root fresh weight, shoot dry weight and root dry weight of different peanut cultivars (Giza 5, Giza 6, Ismailia 1 and Ismailia 2) infected with Meloidogyne arenaria. Bars with different letters are significantly different according to the DMRT.
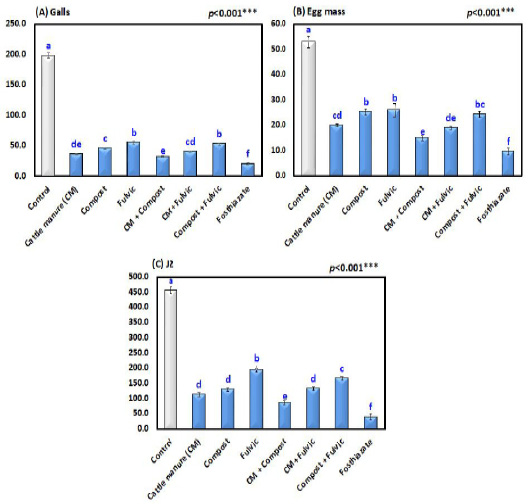
Numbers of galls, egg masses/root system, and final nematode populations (J2s) in different organic amendment treatment groups in peanuts infected with Meloidogyne arenaria. Bars with different letters are significantly different according to DMRT.
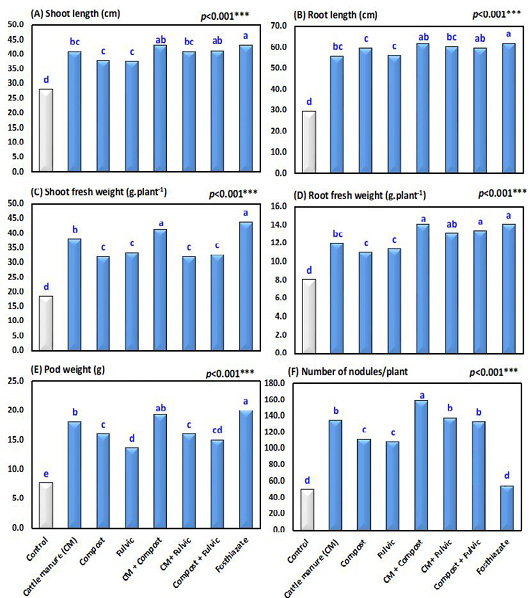
Plant growth parameters of peanuts infected with Meloidogyne arenaria in different treatment groups, including cattle manure, compost, fulvic acid, cattle manure + compost, cattle manure + fulvic acid, compost+ fulvic acid, control (nematode only) and nematicide (fosthiazate 10G) treatments. Bars with different letters are significantly different according to DMRT.
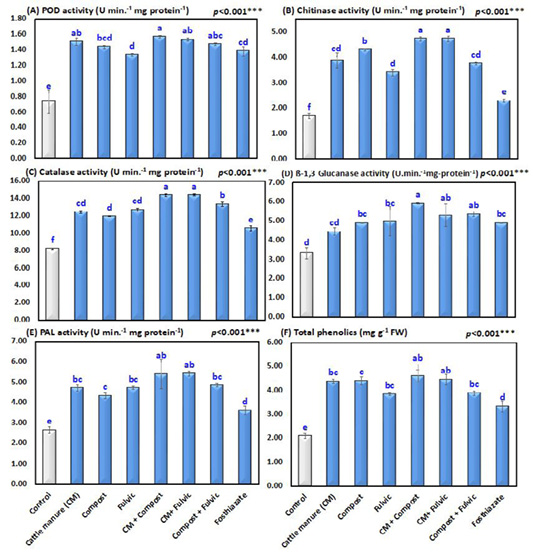
Metabolic enzymes (PPO, CAT, PAL, chitinase and β-1,3 glucanase) and total phenolics in the leaves of peanuts infected with Meloidogyne arenaria in different treatment groups. Bars with different letters are significantly different according to the DMRT.
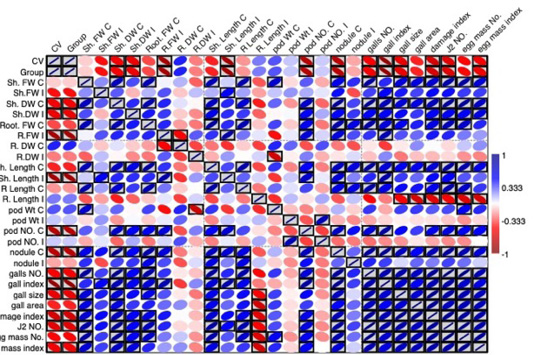
The blue/red heatmaps present the interactions between the studied variables. The blue color indicates a positive direct correlation, the red color indicates a negative inverse correlation, and the white color indicates no correlation. The gray boxed colors indicate significant correlations according to a 2-tailed significance test.
