

Population Structure of Plateau Pika based on Mitochondrial DNA and Microsatellite Analysis


Population Structure of Plateau Pika based on Mitochondrial DNA and Microsatellite Analysis
He Yujiao1,2, Xie Huichun1, Lin Gonghua2,3, ZhangTongzuo2,3, Su Jianping2,3 and Du Yurong1*
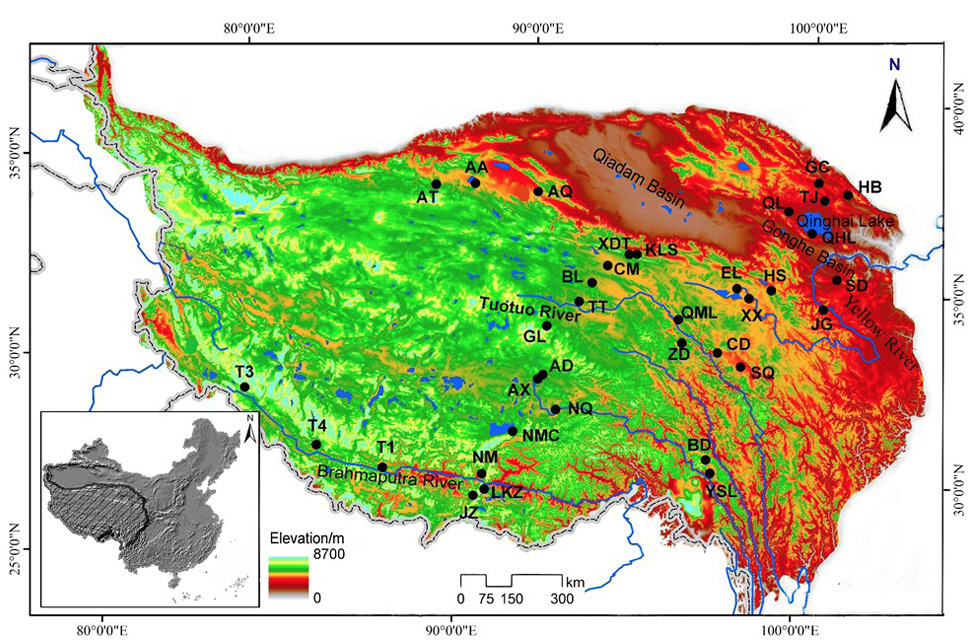
Map of the sampling sites.
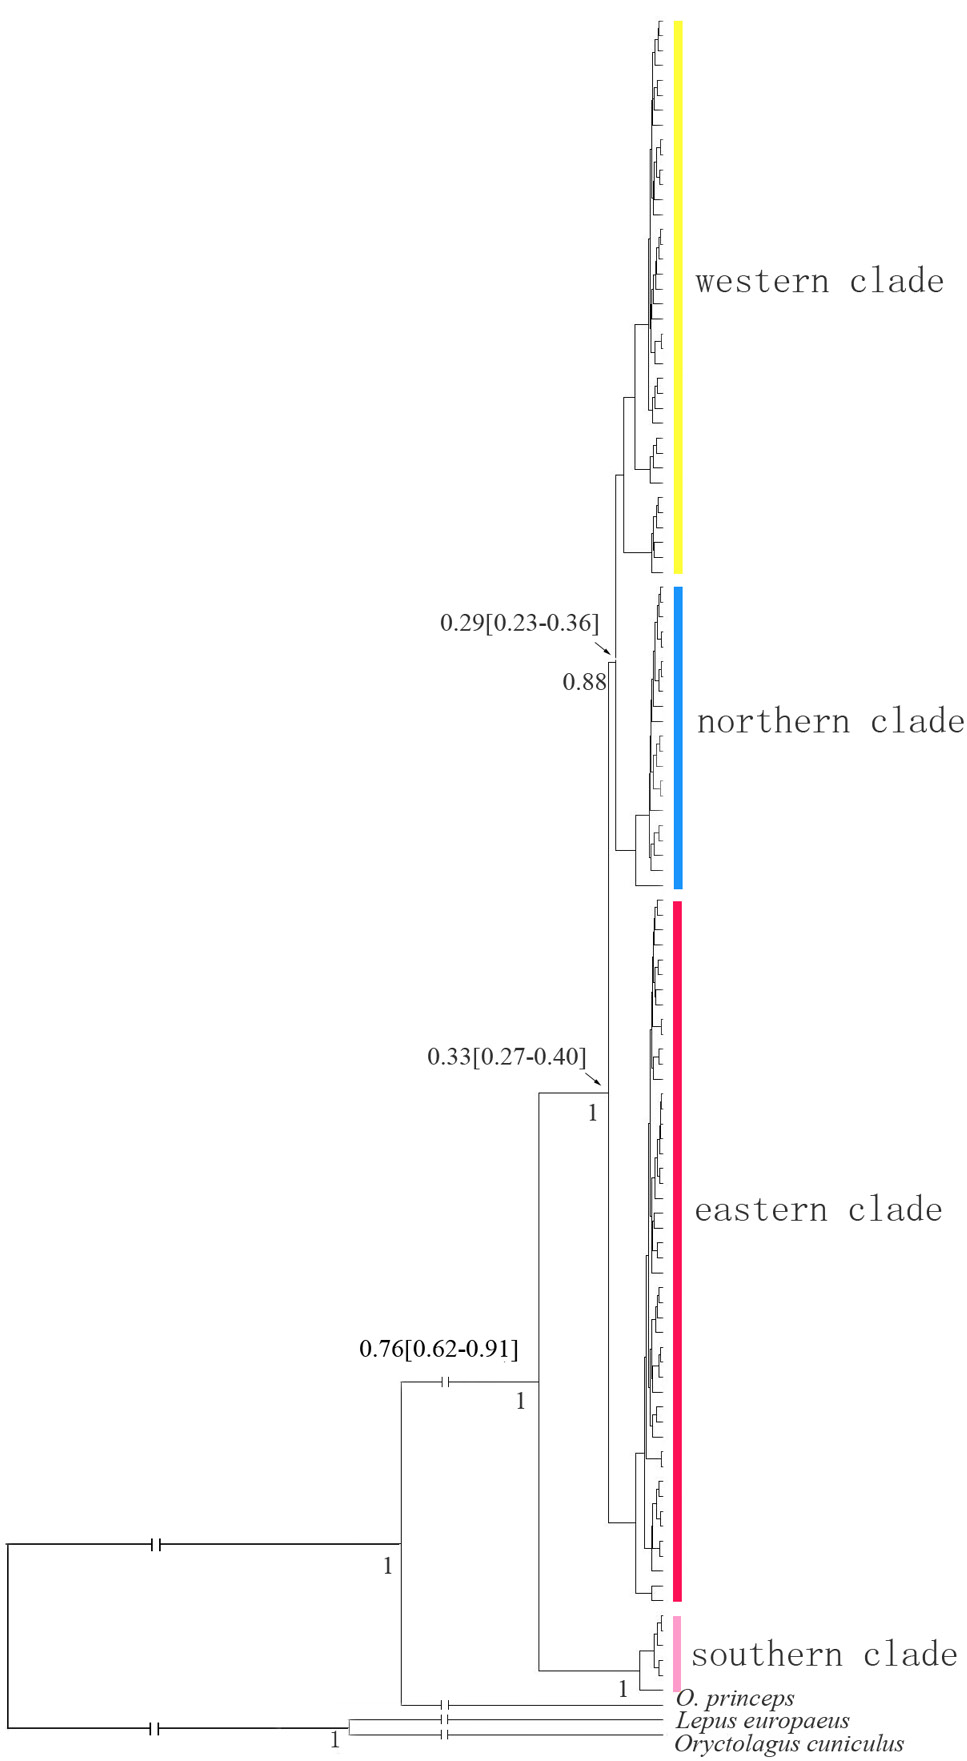
Bayesian inference tree displaying genetic divergence of plateau pika based on mtDNA. Estimates of divergence times with 95% posterior probability intervals are indicated above the branches. Posterior probabilities are indicated under the branches.
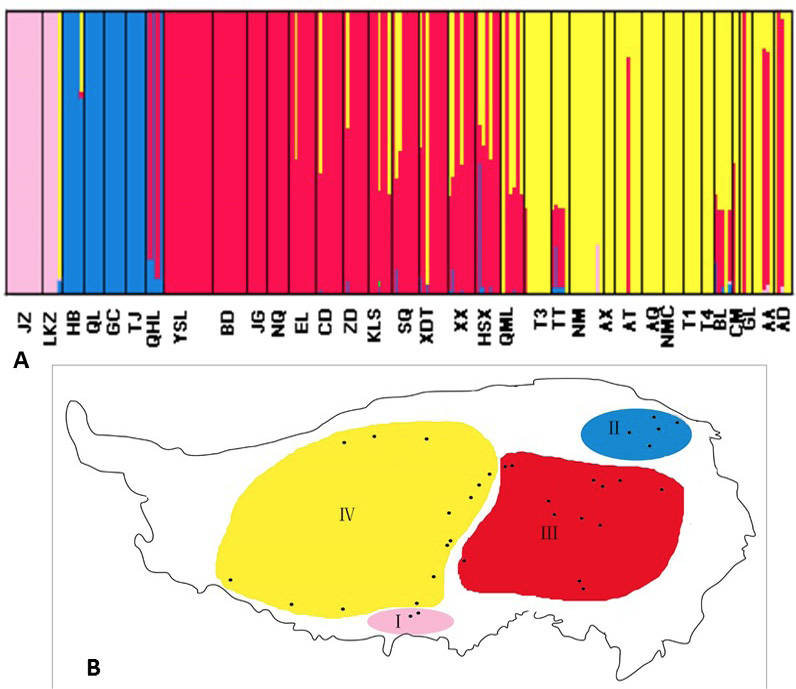
Bayesian clustering of plateau pika populations inferred with the program BAPS using mtDNA markers. (a) Admixture analysis for K=4. (b) Spatial clustering model for K=4. Populations with yellow, red, blue and green represent group I, II, III and IV respectively.
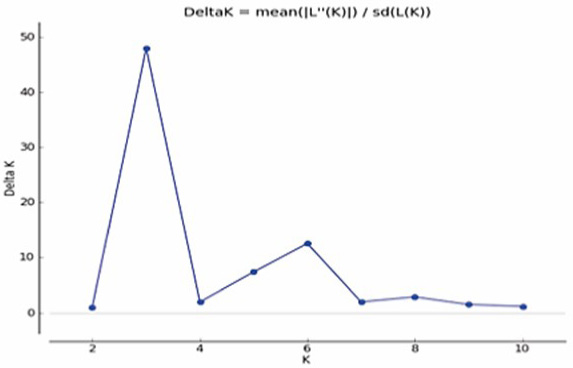
Delta K plotted against the number of genetic clusters (K).

Bayesian individual-based clustering of pika populations with K, 3; K, 4 and K, 5. Each individual is represented by a single vertical bar divided into K colors. The colored segments shows the estimated proportion of membership to each genetic cluster.

Population genetic structure of the plateau pika with K=5 based on microsatellite data.


