


Principal Component and Cluster Analyses as Tools in the Assessment of Genetic Diversity for Late Season Cauliflower Genotypes
Saba Aleem1*, Mehvish Tahir2, Iram Sharif3, Muqadas Aleem4, Muhammad Najeebullah2, Ali Nawaz1, Amina Batool1, Muhammad Imran Khan1 and Waheed Arshad1
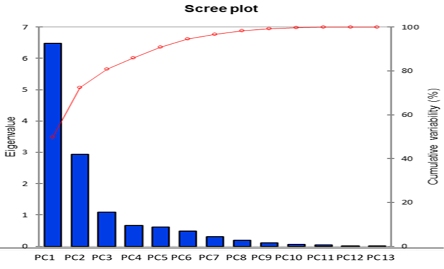
Figure 1:
Scree plot presenting PCs with their cumulative variability.

Figure 2:
Biplot among first two PCs representing genetic diversity.
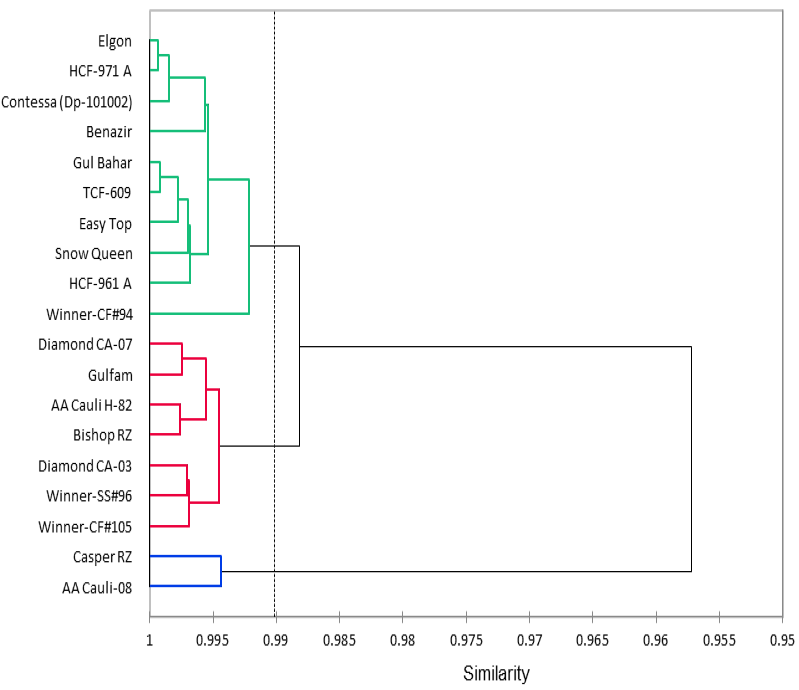
Figure 3:
UPGMA dendogram based on Euclidean distance matrix constructed from 19 phenotypic traits data of 19 cauliflower genotypes.
March 2021
Vol. 34, Iss. 1, Pages 1-253

