Quantification of Plant available Zinc, Copper, Iron, Manganese, Boron, and Visualization of their Spatial Distribution through GIS in District Mandi Bahauddin, Punjab, Pakistan
Quantification of Plant available Zinc, Copper, Iron, Manganese, Boron, and Visualization of their Spatial Distribution through GIS in District Mandi Bahauddin, Punjab, Pakistan
Zahid Hassan Tarar1, Muhammad Salik Ali Khan2*, Shahzada Munawar Mehdi3, Raza Salim4, Irfan Ahmad Saleem1, Saima Nazar5, Munir David2, Tahir Majeed6, Muhammad Sufyan Mughal7, Muhammad Saleem8, Umer Iqbal9, Muhammad Mazhar Iqbal10 and Muhammad Khalid Shaheen3
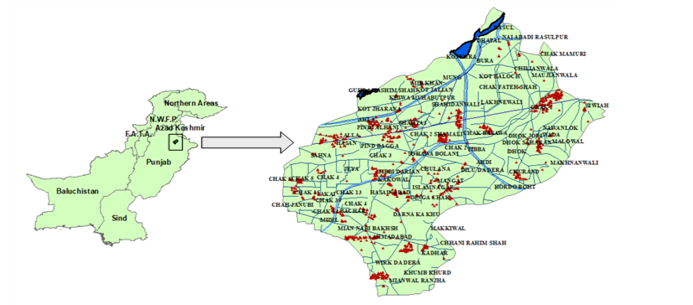
Location Map showing soil sampling points (red dots) in district Mandi Bahauddin.
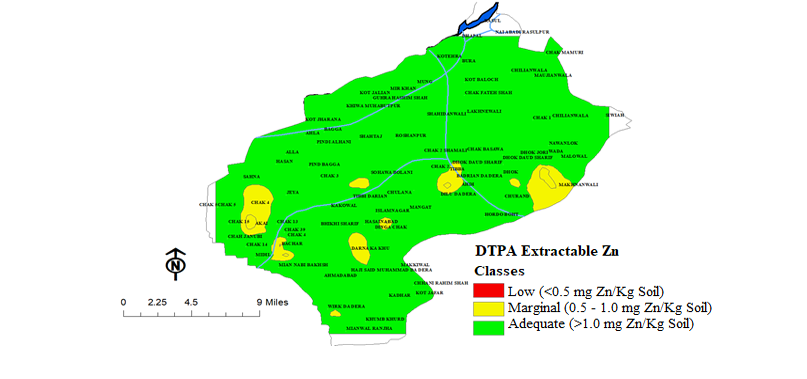
Distribution pattern of DTPA-extractable zinc in district Mandi Bahauddin.
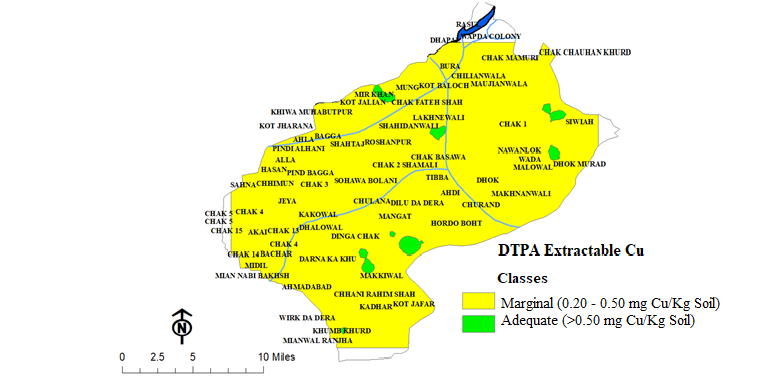
Distribution pattern of DTPA-extractable copper in district Mandi Bahauddin.
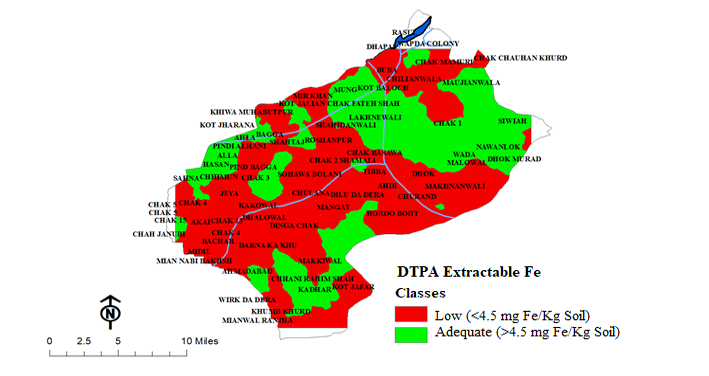
Distribution pattern of DTPA-extractable iron in district Mandi Bahauddin.
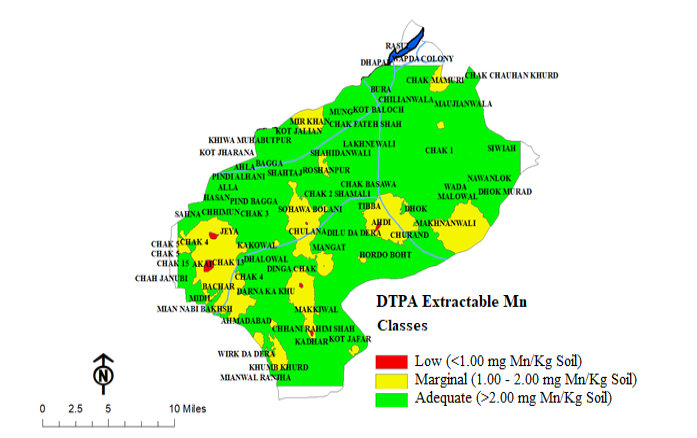
Distribution pattern of DTPA-extractable manganese in district Mandi Bahauddin.
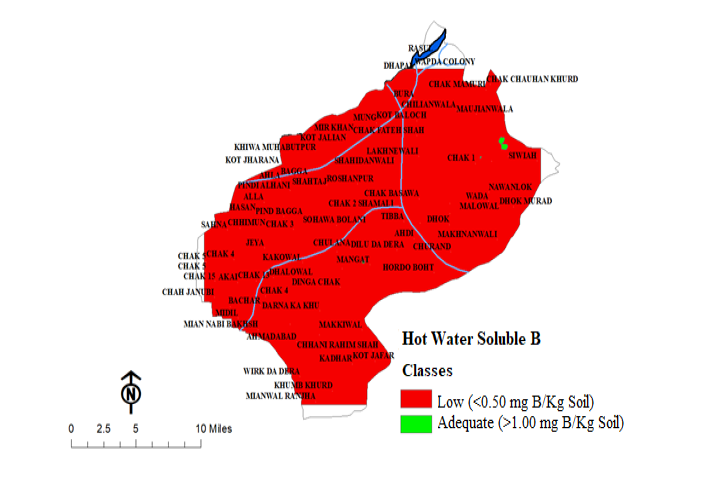
Distribution pattern of hot water-soluble boron in district Mandi Bahauddin.
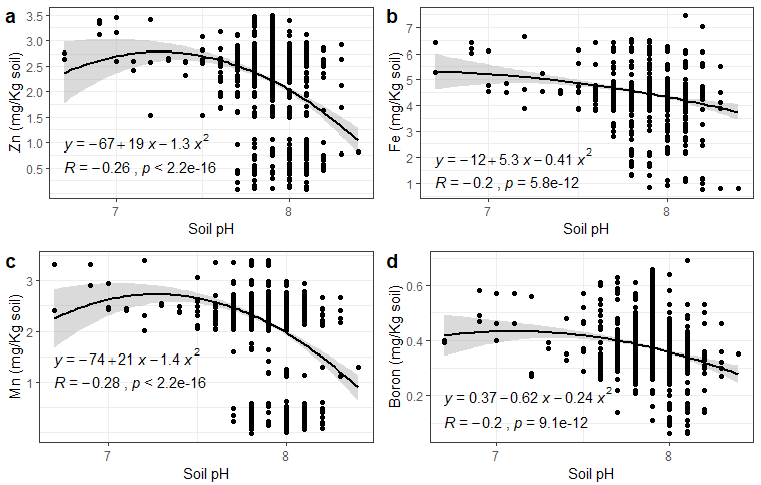
Regression models (polynomial) between Soil pH and (a) Zn (b) Fe (c) Mn and (d) B. Grey shades represent standard error.


