Stock’s Status of Elongate Glass-Perchlet Chanda nama in the Ganges River (Bangladesh): Suggestions for Future Proper Management
Stock’s Status of Elongate Glass-Perchlet Chanda nama in the Ganges River (Bangladesh): Suggestions for Future Proper Management
Md. Asadujjaman1, Md. Yeamin Hossain2*, Most. Farida Parvin3, Most. Shakila Sarmin2, Fairuz Nawer2, Wasim Sabbir4, Md. Ashekur Rahman2, Nur-E-Farjana Ilah2, Md. Joynal Abedin5, Md. Abdus Samad6 and Gitartha Kaushik7
Growth pattern of Chanda nama in the Ganges River, Bangladesh.
Powell-Wetherall regression plot, equation is Y = 1.03–0.255X, r = 0.922 (L∞ = 26.39 cm and Z/K = 2.92).
K-scan routine with growth performance indices in Chanda nama from the Ganges River, Bangladesh.
von Bertalanffy growth curve for Chanda nama in the Ganges River, Bangladesh.
Growth curve of Chanda nama based onVBGF computed growth parameters in the Ganges River, Bangladesh.
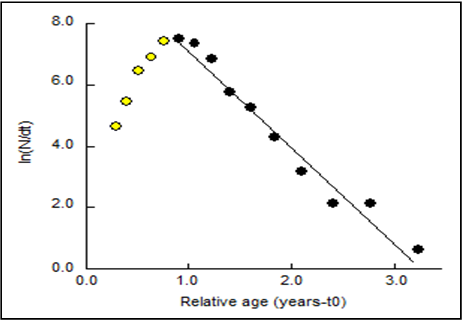
Length-converted catch curve for Chanda nama in the Ganges River, Bangladesh.
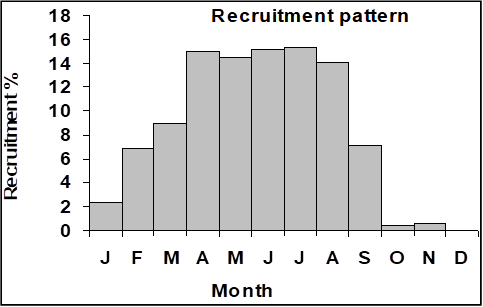
Recruitment pattern of Chanda nama in Ganges River estimated from field data.
Yield-per-recruit and average biomass per recruit models for Chanda nama.
Isopleths, showing optimum fishing activity both in terms of fishing effort and size of first capture.
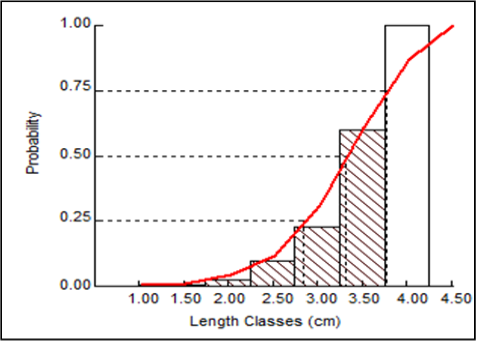
Probability of capture, showing 25%, 50% and 75% selection length of Chanda nama.
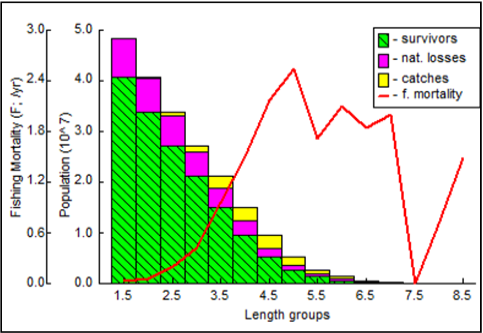
Length-Structured Virtual Population Analysis of Chanda nama in the Ganges River, Bangladesh.


