The Role of Alpha Lipoic Acid and Tempol Against Liver Injury after Acetaminophen Subacute Exposure in Mice
The Role of Alpha Lipoic Acid and Tempol Against Liver Injury after Acetaminophen Subacute Exposure in Mice
Suhad Mohmmed Alrobyrai1 , Falah Muosa Al-Rekabi2*
The effect of orally administration APAP, Tempol, and Lipoic Acid for 30 days on body weight/g of male mice. Data= Mean±SEM, A-D significant (P < 0.05) differences between groups, a-c significant (P < 0.05) differences within groups, LSD of interaction=2.529
The effect of orally administration APAP, Tempol and Lipoic Acid for 30 days on the serum activity of ALT (U/L) in experimental groups. Mean ± SEM, A-D significant (P <0.05) differences between groups, a-b significant (P <0.05) differences within groups, LSD of interaction=40.82.
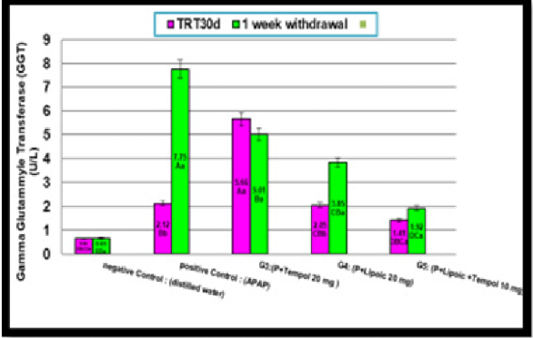
The effect of orally administration APAP, Tempol, and Lipoic Acid for 30 days on the GGT (U/L) in the experimental group. Mean ± SEM, A-D significant (P <0.05) differences between groups, a-b significant (P <0.05) differences within groups, LSD of interaction= 2.714.
The effect of orally administration APAP, Tempol, and Lipoic Acid for 30 days on the PT/ sec in the Experimental group. Mean±SEM, A-D significant (P <0.05) differences between groups, a-b significant (P <0.05) differences within groups, LSD of interaction= 8.289.
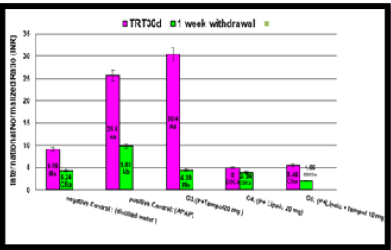
The effect of orally administration APAP, Tempol, and Lipoic Acid for 30 days on the INR in the experimental groups. Mean ± SEM, A-D significant (P <0.05) differences between groups, a-b significant (P <0.05) differences within groups, LSD of interaction= 7.175.
Liver section of mice of C+ve group shows dilated central vein (C.V) with moderate mononuclear cell infiltration (lymphocytes and macrophages) with marked centrelobular necrosis (coagulative N.) × 40H and E stain.
Liver section of mice treated by APAP 700 mg/kgBW and Tempol 20 mg/kgBW orally for one month (G3)shows severe mononuclear cell infiltration) lymphocytes and macrophages (with marked necrotic hepatocytes (coagulative N.)×40 H and E stain.
Liver section of mice treated by APAP 700 mg/kgBW and alpha lipolic acid 20 mg/kgBW orally for 30 days (G4) shows central vein (C.V) with moderate mononuclear cell infiltration and mild centrelobular necrosis (coagulative N.) × 40H and E stain.
Liver section of mice treated by APAP 700 mg/kgBW and Tempol acid 10 plus alpha lipolic acid 10 mg/kgBW orally for one month (G5) shows mild mononuclear cell infiltration (lymphocytes and macrophages) and (M.N Cell) with moderate vacuolar degeneration × 40 H and E stain.


