Thermal Simulation of Grain During Selective Laser Melting Process in 3D Metal Printing
Numan Habib1*, Muftooh Ur Rehman Siddiqi1 and Riaz Muhammad2
Shows the simulation setup (a) step 1/16 (b) step 8/16 (c) step 16/16.
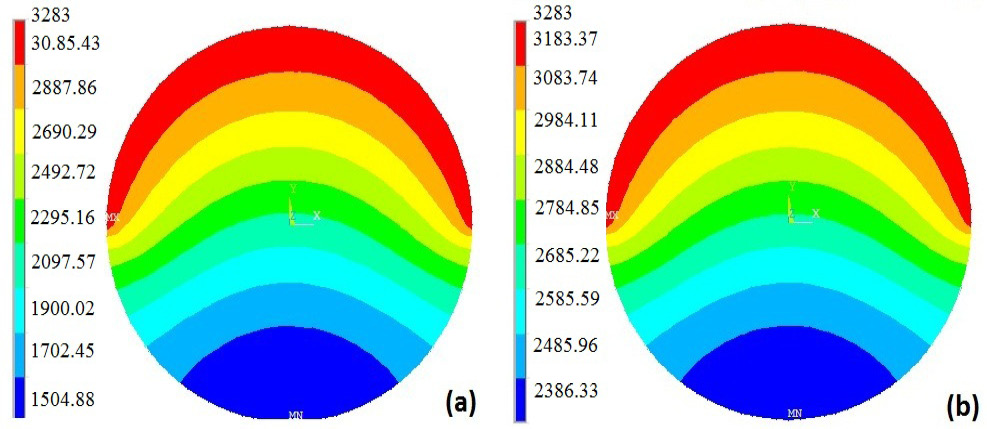
(a) Peak temperature and temperature distribution in nickel (b) Peak temperature and temperature distribution in tungsten.
Comparison of curves achieved in (Zhang et al., 2010) and the current study.
SEM samples at vertical section at v = 110mm/sec, d = 0.05 mm, p = 100 watt (Yan et al., 2015).
The temperature at the focus point of 1µm diameter grain.
The temperature at the focus point of 2µm diameter grain.
The temperature at the focus point of 3µm diameter grain.


