

An Experimental Study of Acupuncture to Rat Model of Obesity: Involvement of SIRT1 Signaling Pathway


An Experimental Study of Acupuncture to Rat Model of Obesity: Involvement of SIRT1 Signaling Pathway
Muzhi Pan1,2, Pengli Si2, Ping Zheng2 and Bingwei Ai2,3*
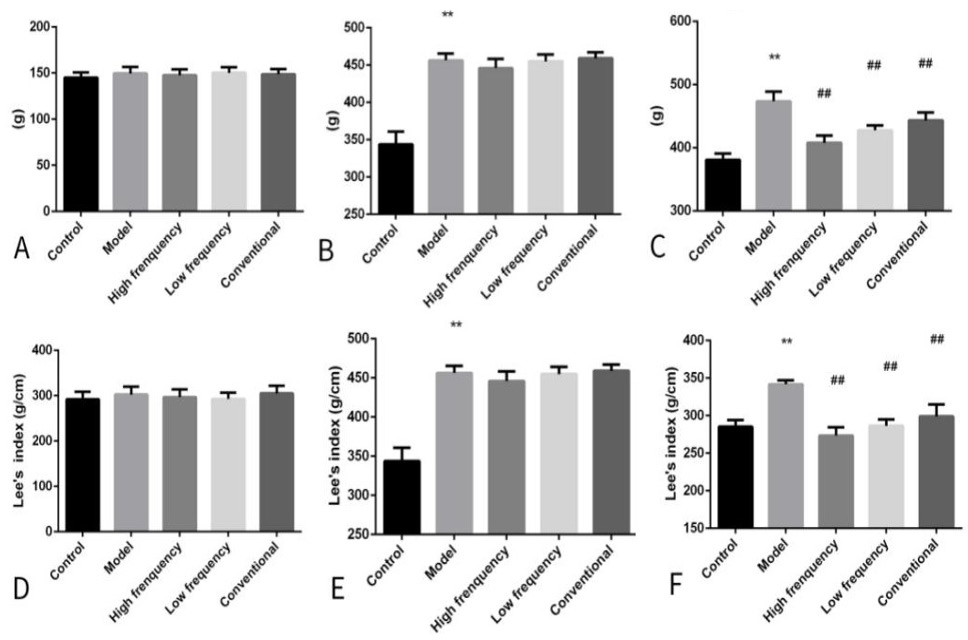
The body weights and Lee index of rats. (A) Body weights before study (0th week), model establishment (8th week), and after last acupuncture (12th week). (B) Lee index at (0th week), model establishment (8th week), and after last acupuncture (12th week). Statistical differences among the model group and other groups were considered significant at the level of *P<0.05, **P<0.01, or ***P<0.001. Meanwhile, differences among the normal acupuncture group and other acupuncture groups were considered at #P<0.05, ## P<0.01 or ### P<0.001.
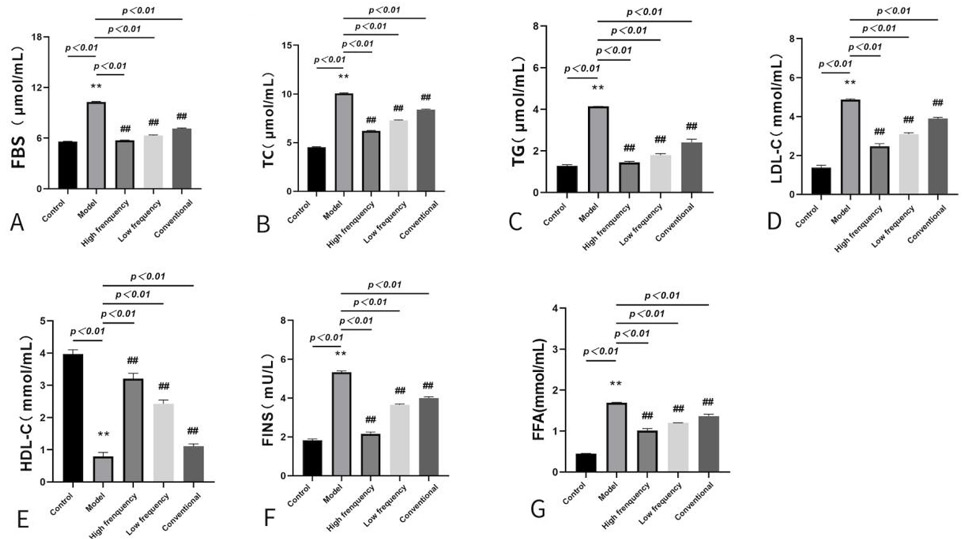
The FBS levels (A), TC levels (B), TG levels (C), LDL-C levels (D), ADP levels (E), insulin levels (F), FFA (G) levels, and HDL-C levels (H) in the serum of rats in groups. Statistical differences among the model group and other groups were considered significant at the level of *P<0.05, **P<0.01 or ***P<0.001. Meanwhile, differences among the normal acupuncture group and other acupuncture groups were considered at #P<0.05, ##P<0.01 or ###P<0.001.
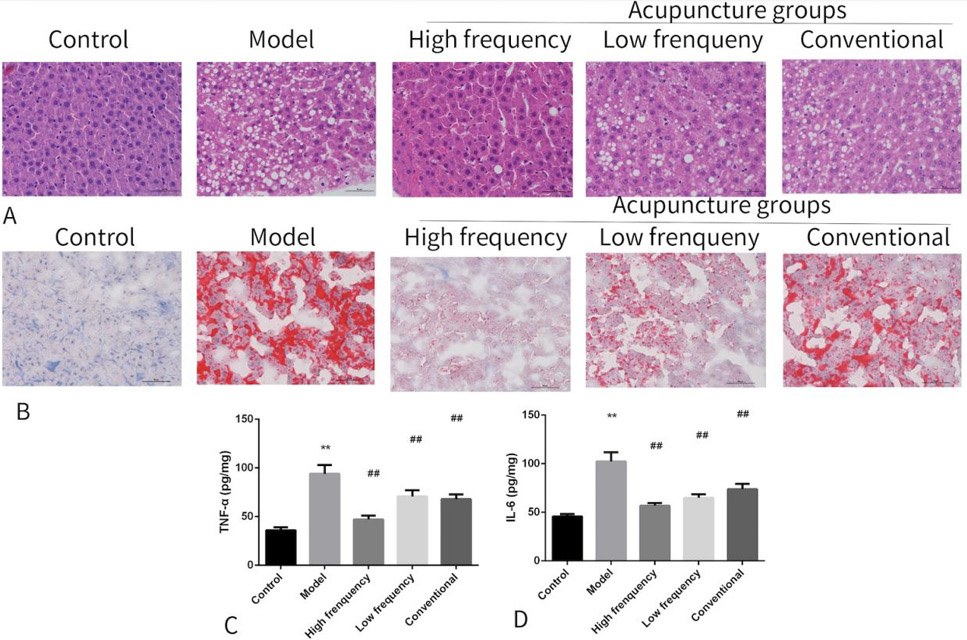
The morphometry observation of rat liver. Representative HE staining of the liver in rats (A). Magnification=*200. The IL-6 levels (B), TNF-α levels (C), Apo-A1 levels (D) and Apo-B levels (E) in the liver of rats within groups. Statistical differences among the model group and other groups were considered significant at the level of *P<0.05, **P<0.01 or ***P<0.001. Meanwhile, differences between the normal acupuncture group and other acupuncture groups were considered at #P<0.05, ##P<0.01 or ###P<0.001.
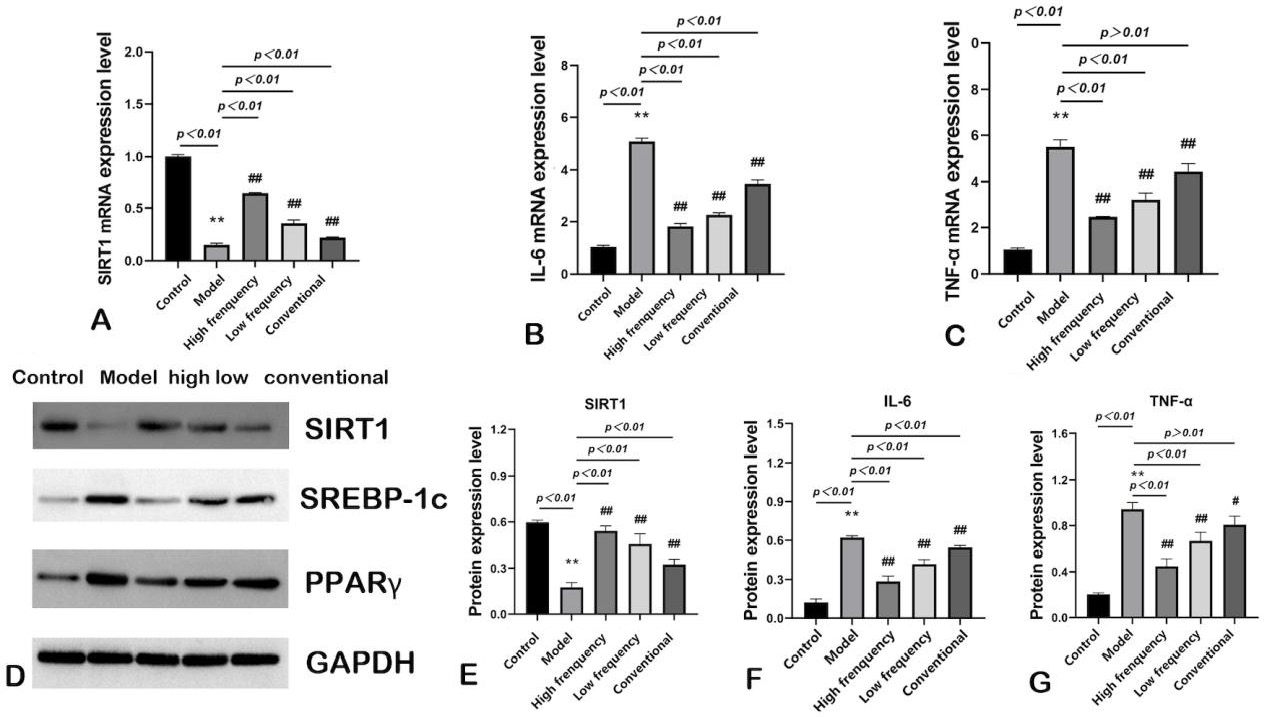
Mechanism validation of acupuncture in a rat model of obesity. (A) The gene of the PCR results. (B) Representative western blot images and quantification of western blot results. Statistical differences among the model group and other groups were considered significant at the level of *P<0.05, **P<0.01 or ***P<0.001. Meanwhile difference between the normal acupuncture group and other acupuncture groups was considered at #P<0.05, ##P<0.01 or ###P<0.001.


