
Comparison of Capsicum Genotypes under In Vitro Saline Stress Induced by Different Concentrations of NaCl and CaCl2


Comparison of Capsicum Genotypes under In Vitro Saline Stress Induced by Different Concentrations of NaCl and CaCl2
Katherine D Leones1, Danny J. Zambrano1, Liliana Corozo-Quiñónez2*, Fátima Macías-Ponce3, Luis Alberto Saltos-Rezabala3, Álvaro Monteros-Altamirano4, Francisco Arteaga-Alcívar3 and Luis Alberto Duicela Guambi5

Effect of NaCl (A) and CaCl2 (B) concentration on the germination percentage (%) of eight Capsicum genotypes under in vitro conditions. Genotypes: g1 = ECU-2254b; g2 = A2a; g3 = 2Cf; g4 = ECU-9123; g5 = ECU-12984; g6 = ECU-2239b; g7 = ECU-2237; and g8 = ECU-12970b. p < 0.001, indicates highly significant differences according to the Scott-knott test.

Effect of NaCl (A) and CaCl2 (B) on the mean germination time (days) for eight Capsicum genotypes under in vitro conditions. Genotypes: g1 = ECU-2254b; g2 = A2a; g3 = 2Cf; g4 = ECU-9123; g5 = ECU-12984; g6 = ECU-2239b; g7 = ECU-2237; and g8 = ECU-12970b. Boxs with same letters are not statistically different according to the Scott-Knott test (p ≤ 0.05); ns = Not significative differences.
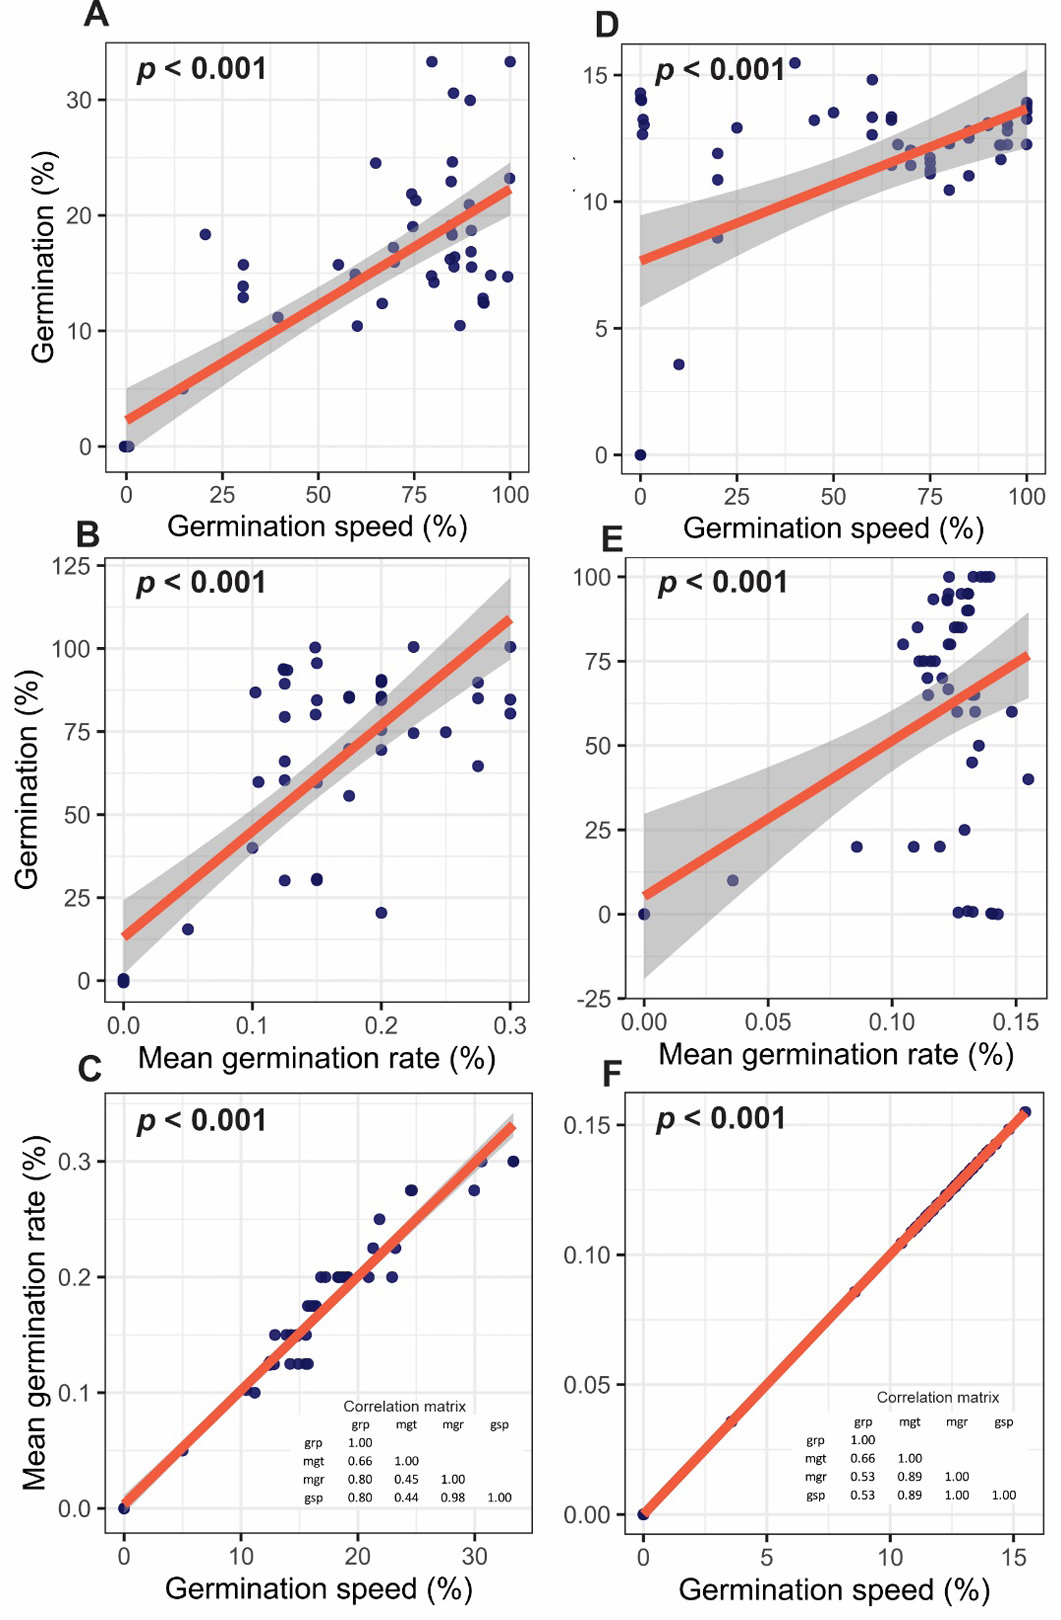
Correlations between germination indices associated with the effect of NaCl (A-C) and CaCl2 (D-F) on Capsicum plants under in vitro conditions. (GRP = Germination percentage; MGT = Mean germination time; MGR = Mean germination rate; GSP = Germination speed). Matrixes correlations indicate the coefficient of Pearson (R2).
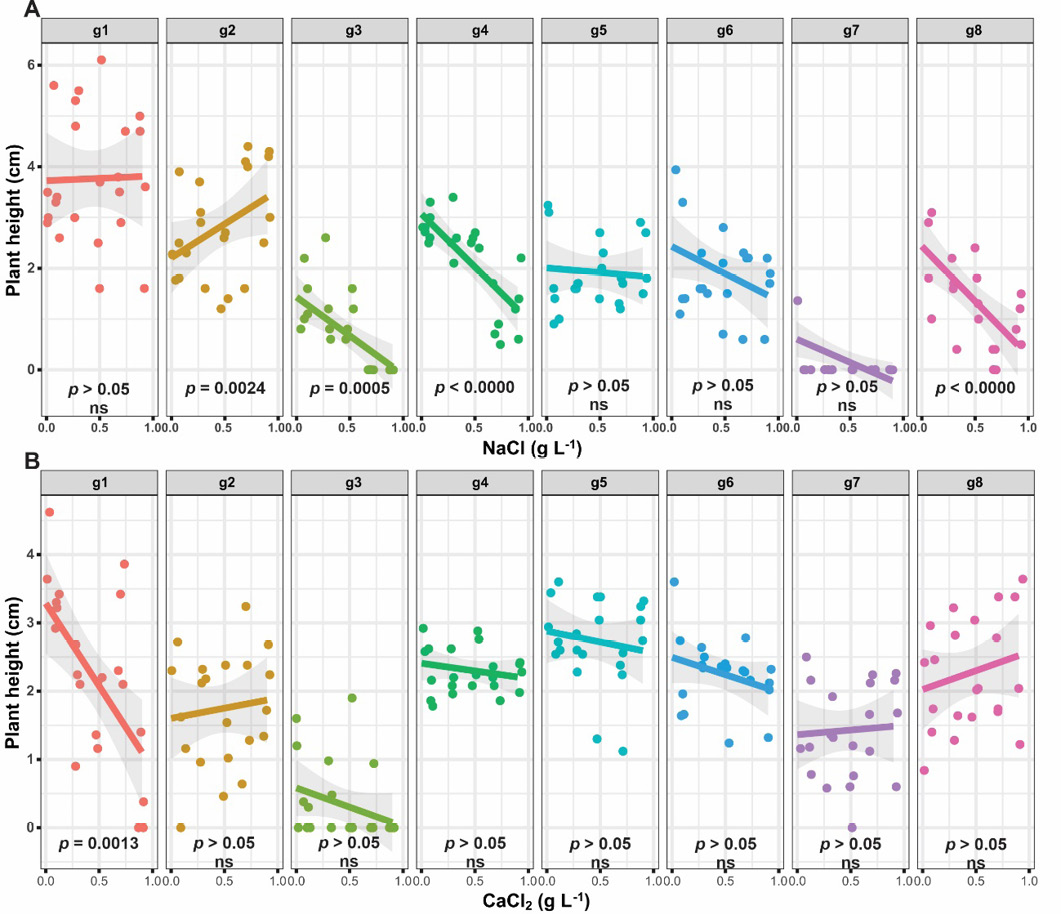
Relationship between concentrations of NaCl (A) and CaCl2 (B) on the seedling height of eigth Capsicum genotypes under in vitro conditions. Genotype: g1 = ECU-2254b; g2 = A2a; g3 = 2Cf; g4 = 9123; g5 = ECU-12984; g6 = ECU-2239b; g7 = 2237; g8 = ECU-12970b. p-values indicate statistical significance or not for the linear regression analysis; ns, indicates non-significant differences.
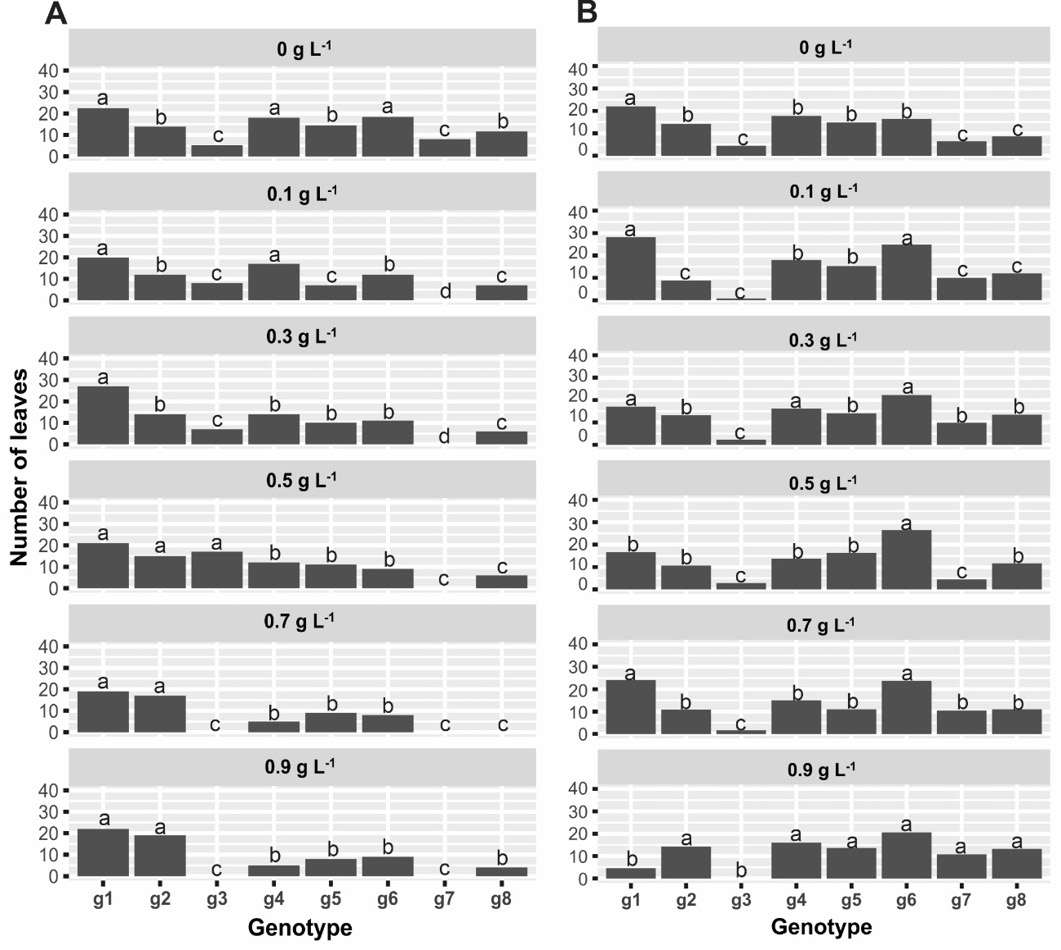
Effect of NaCl (A) and CaCl2 (B) on the number of leaves for nine Capsicum genotypes under in vitro conditions. Genotypes: g1 = ECU-2254b; g2 = A2a; g3 = 2Cf; g4 = ECU-9123; g5 = ECU-12984; g6 = ECU-2239b; g7 = ECU-2237; g8 = ECU-12970b. Bars followed by same letters are not statistically different according to the Scott-Knott test (p ≤ 0.05).


