Deciphering Foot and Mouth Disease Predictive Modeling: Uncovering Attribute Correlations and Risk Factors with Advanced Machine Learning
Deciphering Foot and Mouth Disease Predictive Modeling: Uncovering Attribute Correlations and Risk Factors with Advanced Machine Learning
Mokammel Hossain Tito, Most Hoor E Jannat, Marzia Afrose, S.M. Jubayer Ahmed, Shah Md Maruf, Md. Arafat Hossain, Safiullah Samani, Ruksana Jahan Mira, Barshon Saha, Asraful Islam Jihad and Tonmoy Kumar Das
Representation of the class imbalance in the dataset prior to employing SMOTE technique.
Representation of the balanced class in the dataset after employing SMOTE technique.
Visual representation of various factors in neural network.
Visual working patterns of sequential minimal optimization (SMO) (Arifuzzaman et al., 2021).
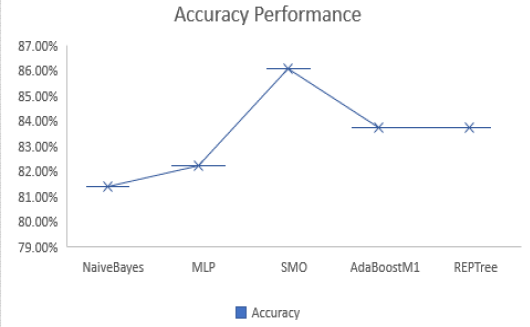
Comparative analysis of accuracy across different machine learning algorithms.
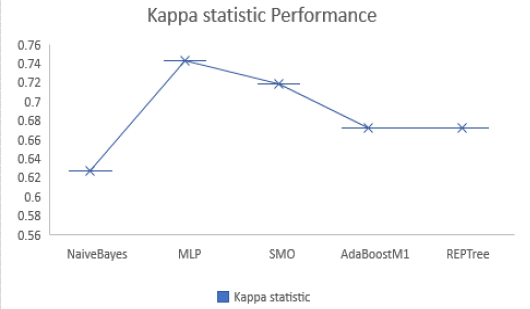
Comparison of kappa statistics among various machine learning algorithms.
Comparing precision performance among various machine learning algorithms.
Recall comparison across machine learning algorithms.
Comparison of F-measure performance across machine learning algorithms
Comparative analysis of Matthews Correlation Coefficients across various machine learning algorithms
Comparison of time consumption among various machine learning algorithms.
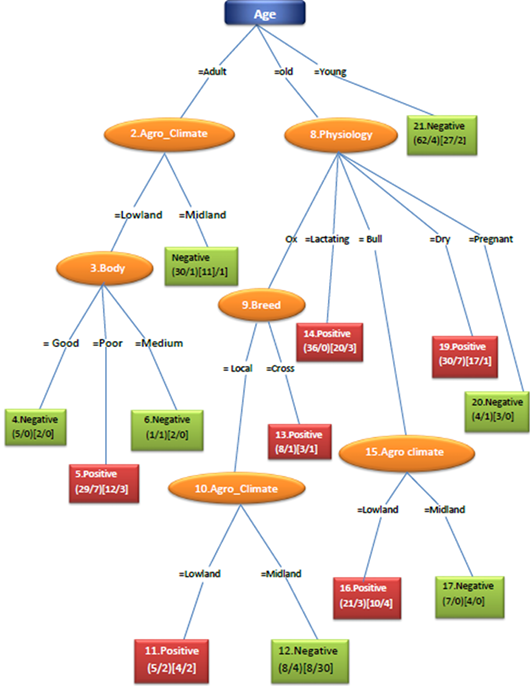
Visual representation of the REP Tree to see the hidden relation of the attributes for the disease occurrence
Operational workflow diagram of the study.


