
Diagnosis of Sarcocystis spp. in Slaughtered Cattle by Molecular Technique in Babylon Province in Iraq


Diagnosis of Sarcocystis spp. in Slaughtered Cattle by Molecular Technique in Babylon Province in Iraq
Wisam Naser Kadhim* and Qassim Gawad Ameer
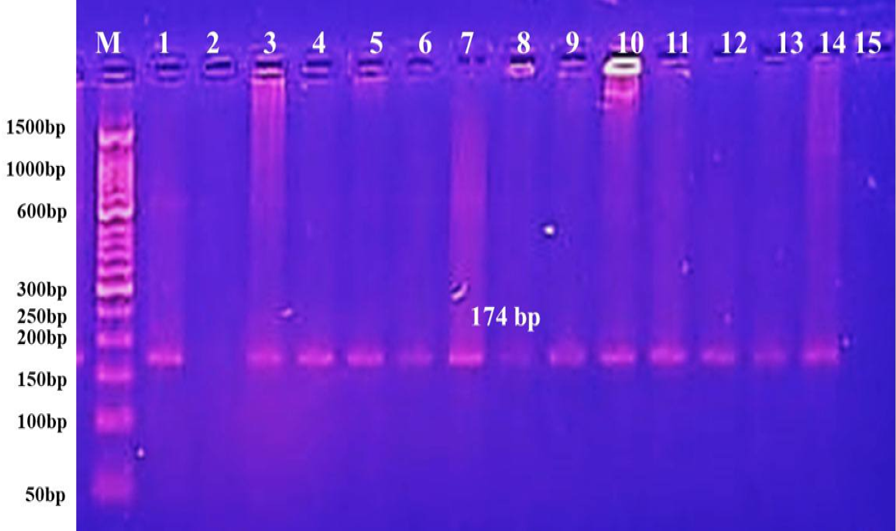
Results of PCR amplification of the internal transcribed spacer 1 gene (ITS1) from isolates of Sarcocystis sp. obtained from cattle are shown. The agarose gel picture displays the 174 bp molecular weight bands of the PCR result. 1500 base pairs (M) indicates the DNA ladder, (1) positive control. Negative oversight (2). A few tissue sample PCR results (3–15).
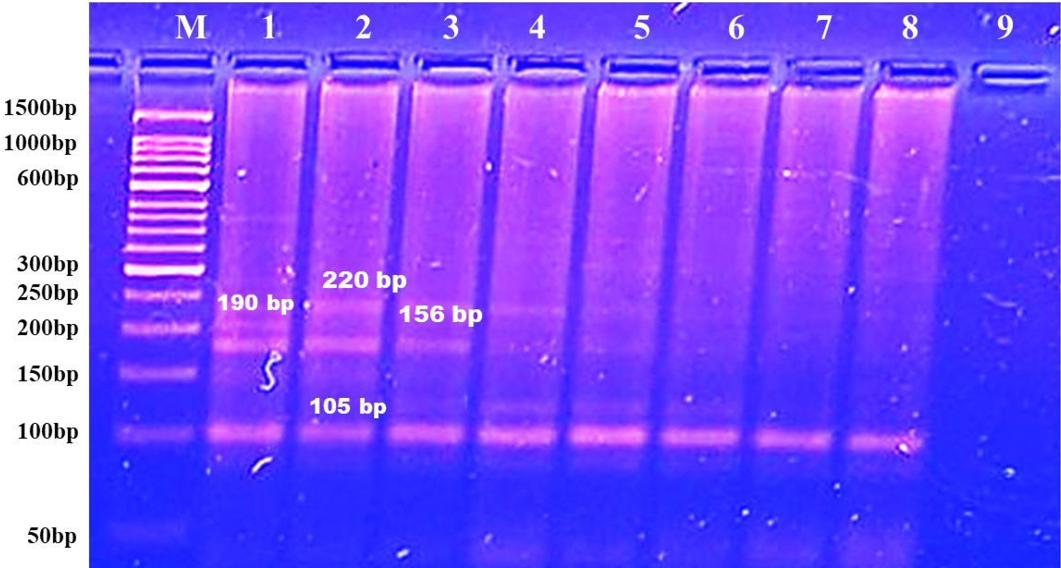
It shows the results of PCR detection 18S rRNA gene for four different species of Sarcocystis. isolated from cattle. Agarose gel pictures appear in the PCR product bands with various molecular weights. (M) refers to (500 bp) DNA ladder, (1) (190 bp) Sarcocystis hominis. (2) (105 bp) Sarcocystis cruzi. (3) (158 bp) Sarcocystis hirsuta. (4) (220 bp) Sarcocystis heydorni.
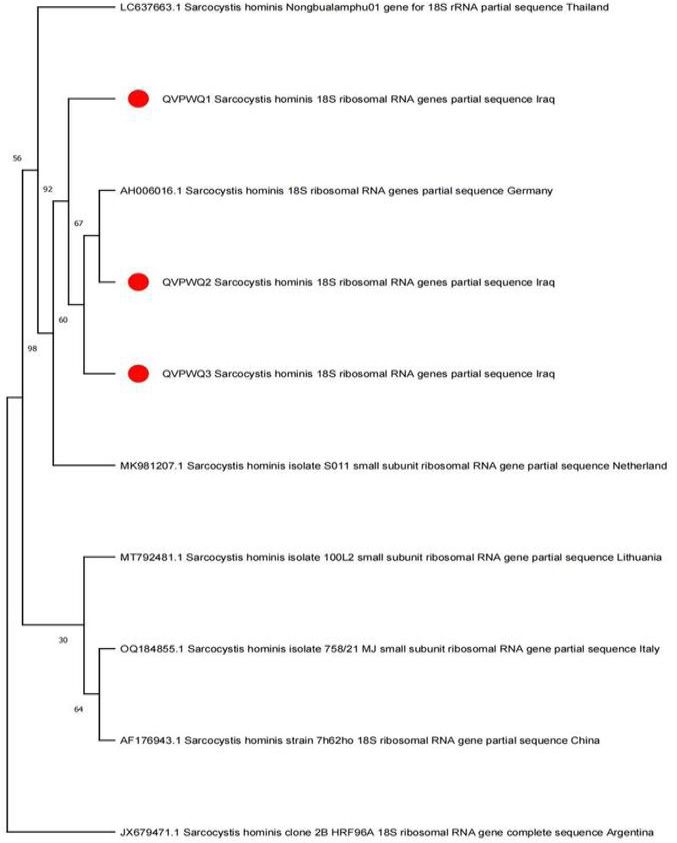
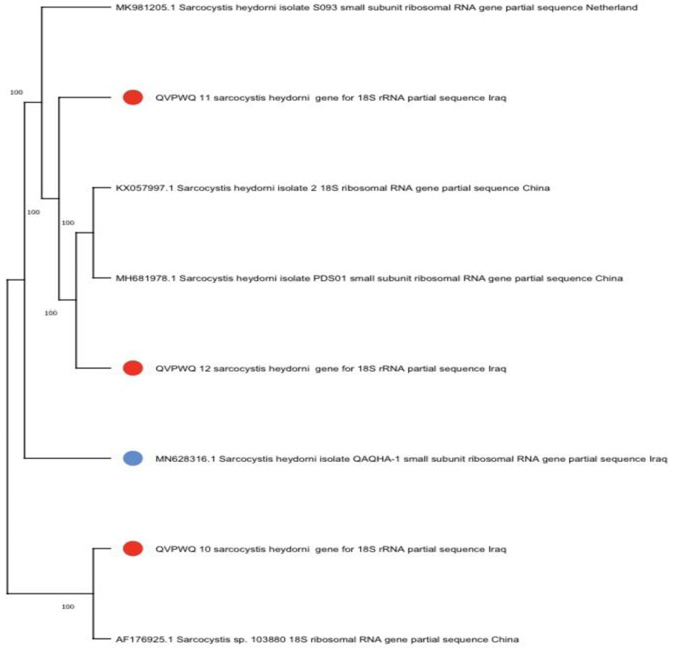
The complete phylogenetic tree of the genetic variations of the Sarcocystis isolate’s 18S rRNA gene fragment. The sequenced S1, S2, and 23 variations are indicated by the red hue, and the corresponding NCBI Sarcocystis hominis deposited species are indicated by the black.
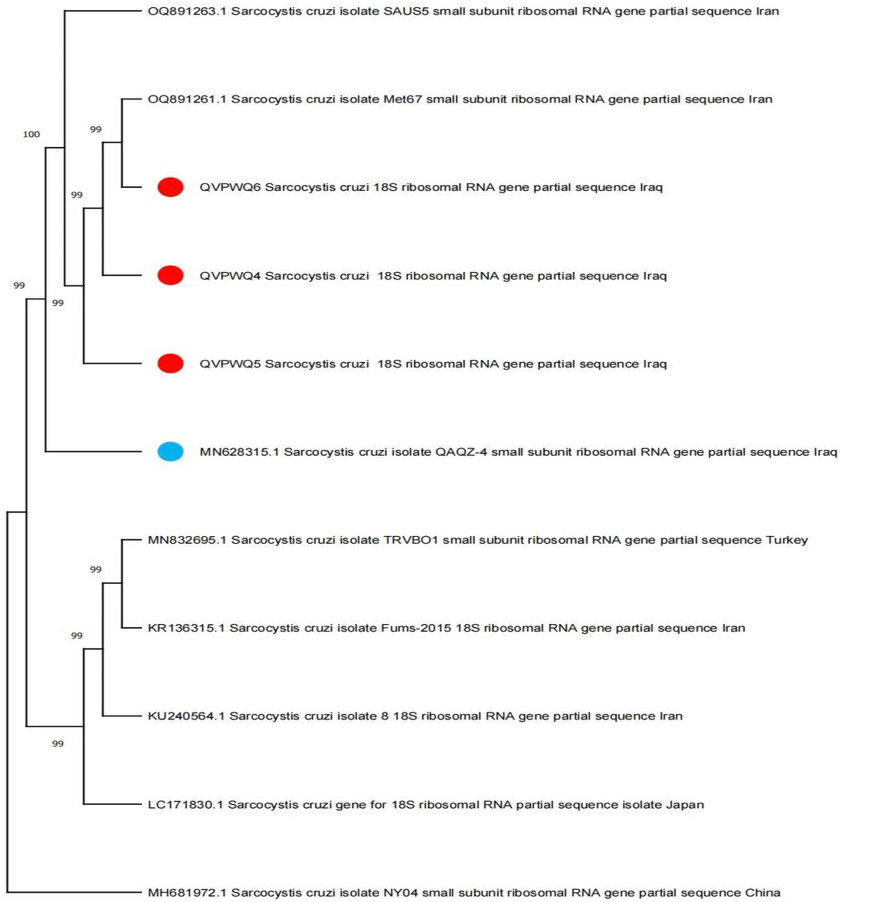
Four isolates of Sarcocystis cruzi are included in the full phylogenetic tree of genetic variations of the 18S rRNA gene fragment. The sequenced S4, S5, and S6 variations are shown by the red color, while the corresponding NCBI Sarcocystis cruzi deposited species are indicated by the black line color.

