Effect of Heat and Drought Stress on the Growth of Selected Grass Species of Pothohar Region


Research Article
Effect of Heat and Drought Stress on the Growth of Selected Grass Species of Pothohar Region
Touseeq Haider1, Saeed Gulzar1, Sabeeqa Usman Malik1*, Aamir Saleem1, Zuhair Hasnain2, Nazakat Hussain3, Syed Ali Abbas1, Amir Hussain4 and Qadir Hussain4
1Department of Forestry and Range Management, Faculty of Agriculture, PMAS Arid Agriculture University Rawalpindi, Pakistan; 2Department of Agronomy, Faculty of Agriculture, PMAS Arid Agriculture University Rawalpindi, Pakistan; 3Department of Plant Pathology, College of Agriculture, University of Sargodha, Pakistan; 4Department of Forestry, Range and Wildlife Management, Karakoram University Gilgit Baltistan, Pakistan.
Abstract | Global pasture production faces significant challenges due to the combined stresses of heat and drought, particularly in arid and semi-arid regions, such as in Pakistan. The study investigated the impact of temperature and drought strain on Chloris gayana and Setaria anceps growth. Plants were exposed to combined stresses including normal (100% Fc and 25˚C), moderate (75% Fc and 30˚C), severe (50% Fc and 35˚C), and high severe (25% Fc and 40˚C) conditions. Physiological parameters, including soil moisture content, relative water content, and chlorophyll content reduced under severe conditions. However, results showed that SMC differences decreased at 54% in Setaria anceps and 52% in Chloris gayana, similarly for RWC% at 27 and 26 in the first data set, while 29 and 25 in the second dataset, and total chlorophyll content at 0.25 and 0.22 mg/g in the first dataset, while 0.25 and 0.20 mg/g of fresh weight in the second dataset. Morphological parameters, including height, number of leaves per tiller, and biomass also decreased. The maximum and minimum biomass values were 9 and 2g in Chloris gayana and 7 and 2g in Setaria anceps grass. However, Chloris gayana slightly performed better than Setaria anceps in all parameters. The results were analyzed using SPSS, Complete Randomized Design (CRD) one-way ANOVA with a probability threshold of 0.05%.
Received | September 09, 2024; Accepted | October 28, 2024; Published | January 09, 2025
*Correspondence | Sabeeqa Usman Malik, Department of Forestry and Range Management, Faculty of Agriculture, PMAS Arid Agriculture University Rawalpindi, Pakistan; Email: Sabeeqa.usman@uaar.edu.pk
Citation | Haider, T., S. Gulzar, S.U. Malik, A. Saleem, Z. Hasnain, N. Hussain, S.A. Abbas, A. Hussain and Q. Hussain. 2025. Effect of heat and drought stress on the growth of selected grass species of Pothohar region. Sarhad Journal of Agriculture, 41(1): 32-41.
DOI | https://dx.doi.org/10.17582/journal.sja/2025/41.1.32.41
Keywords | Drought stress, Heat stress, High temperature, Morphology, Physiology
Copyright: 2025 by the authors. Licensee ResearchersLinks Ltd, England, UK.
This article is an open access article distributed under the terms and conditions of the Creative Commons Attribution (CC BY) license (https://creativecommons.org/licenses/by/4.0/).
Introduction
The growth and development of crops are significantly hampered by drought and heat stress, making them important hazards to the farming sector. Looking ahead, there is increasing worry that the frequency, length, and severity of abiotic stresses may increase, potentially having disastrous repercussions for crop and forage productivity. These effects, in turn, may negatively affect livestock productivity (Zhou et al., 2017). The average world temperature is steadily rising due to the current pace of global warming, rising by 0.2 °C every ten years. The global mean temperature is predicted to rise 1.5 °Cover pre-industrial levels (1850–1900) by 2050 if this trend continues (IPCC, 2018).
Chloris gayana (Rhode grass) is an African warm-season forage grass found mostly in tropical and subtropical areas of the world. It is robust and yields good feed in its early stages, and it is currently being introduced into temperate zones across the world. As a result, it is currently very prolific and can withstand climatic changes (Imaz et al., 2015). Setaria anceps (Setaria grass), often known as African pigeon grass, is a versatile plant that can thrive in a range of climatic situations. It is useful in agriculture and ecology. It has huge leaves, may grow to a height of 2 meters, and produces a high biomass under various circumstances. This makes this grass useful as hay and as feed (Smith et al., 2010).
In Pakistan, the majority of the region is typically arid to semi-arid with high temperatures and little precipitation, making drought one of the world’s most important environmental threats now. On the southern Himalayan slopes, annual precipitation is at its peak (1,500 mm), and it progressively declines in the southwest. Merely 9% of Pakistan gets additional rain than 508 mm annually. The remaining 69% receive less than 254 millimeters of annual rainfall, while another 22% receive between 254 and 508 mm (Riaz et al., 2010). Usually, plant growth starts with the division of cells, cell enlargement, and cell differentiation. However, stress conditions disturb the processes of mitosis and cell division, due to which the overall growth of plants is significantly affected and results in short or stunted growth (Hussain et al., 2008). Rising temperatures and insufficient availability of water to the plant adversely affect the germination potential and early seedling, due to which the plant cannot perform vital processes effectively and results in less vegetative growth of field crops (Okçu et al., 2005).
High temperature stress causes morphological, biochemical, and physiological changes that significantly impact plant progression and improvement (Wahid et al., 2007). Nelimor et al. (2019) discovered a strong positive association between maize grain output under heat and collective drought and temperature shocks, suggesting that heat-resistant genotypes will most probable endure scarcity and stress. In the current situation, rising air temperatures are causing heat shocks that severely reduce crop output across the globe. Potential difficulties brought on by this temperature increase include adjustments in the geographical distribution of agricultural products and changes to the growing seasons (Porter, 2005). If this situation continues, the temperature can rise to 0.2°C every decade, the main cause of this increasing temperature is global warming due to greenhouse gases. Carbon dioxide and methane concentrations have increased significantly over the past 250 years, by 30 and 150%, respectively, according to observation (Lal, 2004; Friedlingstein et al., 2010). They have the biggest influence on limiting plant development and lowering production, among numerous environmental conditions. For instance, research simulations have demonstrated that with every degree Celsius increase in temperature, world wheat production might decline by 6% (Asseng et al., 2011). Even though crop productivity in certain cooler places can benefit from rising temperatures, the overall impact on global food security continues to be primarily negative (Challinor et al., 2014).
This research has the following objectives:
- To assess the physiological responses of Chloris gayana and Setaria anceps under heat stress and drought stress circumstances
- To evaluate the influence of combined stresses on plant growth, including height and biomass accumulation.
Materials and Methods
Study area
The research directed at PMAS-Arid Agriculture University in Rawalpindi, which is located in Rawalpindi, Punjab, Pakistan. The coordinates of the study area are 33.647°N 73.083°E and the total covered area is 1730 acres. The area experiences warm summers and cold winters. Average annual precipitation can surpass 1000mm, primarily occurring during the monsoon season. While the average temperature is 21.3˚C. The months of June and July are the warmest, whereas December and January are the chilliest months (Arshadullah et al., 2012). The Pothohar region has a lot of poaceous flora, which is economically significant for housing many birds and mammals, producing hay, building materials, and serving as a source of folk remedies in addition to supplying food for domestic animals and wildlife species (Ahmad et al., 2010).
Experimental design
The research was carried out in the greenhouse of a forest nursery, where tufts were grown in pots under normal circumstances for one week to stabilize. The pots were then taken to the lab for oven stress testing. 32 pots were grown, four for Chloris gayana and four for Setaria anceps, because all four treatments were examined for both species. Each treatment or pot was replicated four times, resulting in a total of 32 pots produced for this research trial. Each pot was filled with the usual soil found in Rawalpindi, Islamabad. In each pot, one tuft of at least five tillers was developed. The source of tufts was the National Agricultural Research Centre (NARC). Then combine heat and drought stress treatments provided to each pot in the experiment. Data was gathered after one month and after the two-month trial.
Combined stress
Combined stressors were applied to all treatments for both species, heat stress was applied for one hour daily, which is listed below.
- 25°C and 100% FC (normal, no stress)
- 30°C and 75% FC
- 35°C and 50% FC
- 40°C and 25% FC (Jazi et al., 2019)
Physiological parameters
After subjecting the species to combined stress, physiological responses such as soil moisture content, relative leaf water content, and chlorophyll content were examined.
Soil, moisture, content (SMC)
Moisture of soil content was determined to track the gradual drying of the soil over time. The mass of soil was determined using water, and the pots were weighed. The following equation was used to calculate soil moisture content.
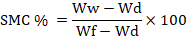
Where, Ww is the weight of soil with water in pots, WD is the Weight of dry soil in pots, Wf is the weight of fully wet soil in pots (Milbau et al., 2005).
Relative water content (RWC)
According to the methodology employed by Jiang and Huang (2001), the water content of the leaf (WC) was assessed. Cut off the center leaf from the individual plant and record its new weight. The leaf was then and there placed in a water-filled test tube and left to hydrate for five hours in the dark. After 5 hours, surface water was sponged up and dried with tissue paper to calculate the cumbersome weight. The leaves dry weight was determined after 48 hours of oven storage at 60°C. The following formula was used to determine RWC, as shown below.
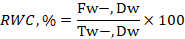
Here, F.W. is fresh-weight. D.W is dry –weight and T.W = Turgid –weight.
Chlorophyll content (Chl)
Leaf samples were collected and extracted using 85% acetone solution. And maintained in the refrigerator for 24 hours at 4°C in the dark to assess the chlorophyll content. The wavelength of the sample was measured at 470, 647, and 664 nm using a spectrophotometer. Chlorophyll content was measured using the formula given below.
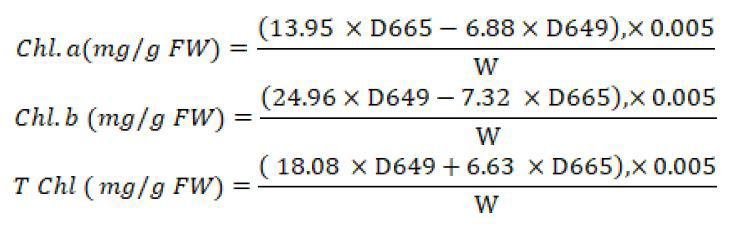
Here, D is the absorbance of the sample likewise W, is the fresh weight of leaves (g) (Wassie et al., 2019).
Morphological parameters
Morphological parameters were the number of leaves per tiller, the number of tillers per plant, plant height, and biomass. The number of tillers per plant and the number of leaves per tiller were counted. Height was measured using measuring tape of 100 ft. Fresh weight was examined after harvesting above the ground at the end of the growing period and placed in the bags. Simply weighed the sample with an electrical balance or with the help of a weighing scale or machine by subtracting the weight of the bag. Dry weight was measured after harvesting and keeping in the oven for 24 hours at 105˚C (Rizwan et al., 2019).
Statistical analysis
The records were analyzed using SPSS. The significance of the data was determined using a complete randomized design (CRD) and one-way analysis of variance (ANOVA). All data are expressed as the mean of four replicates. Both species’ results were compared with a probability threshold of 5%.
Results and Discussion
The combination of both rising temperature and water scarcity had a significant influence on the growth of grass species. As the strain level increased, the SMC decreased and vice versa. Table 1 shows the relationship between the percentage soil moisture content of Chloris gayana and Setaria anceps. The maximum and minimum value for Chloris gayana is 65 and 13% at a difference of 52%. The maximum and minimum percentages of Setaria anceps are 67 and 13 and the difference is 54% as shown in Table 1.
Table 1: Soil moisture content % of Chloris and Setaria grass.
|
Sample ID |
Treatment |
SMC % chloris |
SMC % setaria |
|
1 |
100% Fc and 25°C |
61.503 |
62.442 |
|
2 |
100% Fc and 25°C |
64.789 |
63.616 |
|
3 |
100% Fc and 25°C |
65.963 |
66.198 |
|
4 |
100% Fc and 25°C |
62.445 |
67.606 |
|
5 |
75% Fc and 30°C |
46.127 |
46.831 |
|
6 |
75% Fc and 30°C |
48.357 |
49.531 |
|
7 |
75% Fc and 30°C |
50 |
51.174 |
|
8 |
75% Fc and 30°C |
50.705 |
50.939 |
|
9 |
50% Fc and 35°C |
30.752 |
31.221 |
|
10 |
50% Fc and 35°C |
31.925 |
34.742 |
|
11 |
50% Fc and 35°C |
29.578 |
32.395 |
|
12 |
50% Fc and 35°C |
32.864 |
33.334 |
|
13 |
25% Fc and 40°C |
15.376 |
15.611 |
|
14 |
25% Fc and 40°C |
15.963 |
14.789 |
|
15 |
25% Fc and 40°C |
14.554 |
13.616 |
|
16 |
25% Fc and 40°C |
13.849 |
15.963 |
Table 2: RWC % 1st data of Chloris and Setaria grass.
|
Sample ID |
Treatment |
RWC % Chloris |
RWC % Setaria |
|
1 |
100% Fc and 25°C |
80.769 |
80 |
|
2 |
100% Fc and 25°C |
79.167 |
84 |
|
3 |
100% Fc and 25°C |
80.953 |
82.5 |
|
4 |
100% Fc and 25°C |
82.759 |
82.25 |
|
5 |
75% Fc and 30°C |
72.223 |
76.36 |
|
6 |
75% Fc and 30°C |
70.769 |
77.77 |
|
7 |
75% Fc and 30°C |
71.429 |
78.94 |
|
8 |
75% Fc and 30°C |
70.313 |
79.68 |
|
9 |
50% Fc and 35°C |
65.625 |
69.23 |
|
10 |
50% Fc and 35°C |
66.667 |
70 |
|
11 |
50% Fc and 35°C |
65.518 |
70 |
|
12 |
50% Fc and 35°C |
66.667 |
67.85 |
|
13 |
25% Fc and 40°C |
58.621 |
59.37 |
|
14 |
25% Fc and 40°C |
56.098 |
57.57 |
|
15 |
25% Fc and 40°C |
57.895 |
58.97 |
|
16 |
25% Fc and 40°C |
56.757 |
55.88 |
RWC also decreased so much in high-stress levels compared to normal or moderate stress level treatments. Table 2 illustrates the relationship between the relative water content of Chloris gayana and Setaria anceps. According to the results, the maximum and minimum percentages of Chloris gayana are 82 and 56 with a difference of 26%. The maximum and minimum values of Setaria anceps are 84 and 55 with a difference of 29% as shown in Table 2. The prolonged stress period also significantly affects the RWC% depicted in Table 3, which illustrates the relationship between the relative water content of Chloris gayana and Setaria anceps. The greatest and lowest percentage of Chloris gayana are 77 and 50% with a difference of 27%. The maximum and minimum values of Setaria anceps are 79 and 50% with a difference of 29% as shown in Table 3.
Table 3: RWC % 2nd data of Chloris and Setaria grass.
|
Sample ID |
Treatment |
RWC % Chloris |
RWC % Setaria |
|
1 |
100% Fc and 25°C |
75 |
79.412 |
|
2 |
100% Fc and 25°C |
72.728 |
76.924 |
|
3 |
100% Fc and 25°C |
73.334 |
76.191 |
|
4 |
100% Fc and 25°C |
77.778 |
77.419 |
|
5 |
75% Fc and 30°C |
69.231 |
71.739 |
|
6 |
75% Fc and 30°C |
68 |
70.149 |
|
7 |
75% Fc and 30°C |
66.667 |
73.685 |
|
8 |
75% Fc and 30°C |
63.158 |
70.589 |
|
9 |
50% Fc and 35°C |
60 |
66.038 |
|
10 |
50% Fc and 35°C |
61.112 |
61.765 |
|
11 |
50% Fc and 35°C |
61.112 |
65.625 |
|
12 |
50% Fc and 35°C |
60.527 |
63.334 |
|
13 |
25% Fc and 40°C |
50 |
54.546 |
|
14 |
25% Fc and 40°C |
55.173 |
55.556 |
|
15 |
25% Fc and 40°C |
55 |
52.174 |
|
16 |
25% Fc and 40°C |
54.546 |
50 |
Increasing temperature and water limitation negatively affected the chlorophyll content (Chl a, b, and total Chlorophyll) of both species. Figures 2 and 3 show the relationship between different treatments and chlorophyll content (a, b, and total chlorophyll) of Chloris gayana and Setaria anceps. In these figures, sample IDs from 1 to 4 are the replications of (100 % Fc and 25°C), similarly 5 to 8 are replications of 75 % Fc and 30°C. While sample IDs from 9 to 12 are replications of 50% Fc and 35°C and sample IDs from 13 to 16 are replications of 50% Fc and 40°C. The maximum and minimum values of total
chlorophyll of Chloris gayana are 0.40 and 0.18, resulting in a difference of 0.22 mg/g of fresh weight. Analyzed data depicted that, the level of significance or p-value is less than 0.05%, as shown in Table 4. The highest and lowest values for Chl (a) are 0.27 and 0.14, while for Chl (b), they are 0.1266 and 0.0029, as shown in Figure 2. For Setaria grass, maximum and minimum total chlorophyll values are 0.38 and 0.13, with a difference of 0.25 mg/g of fresh weight, as shown in Figure 3. The highest and lowest values for Chl (a) in Setaria are 0.22 and 0.09, while for Chl b, they are 0.1738 and 0.0092mg/g as shown in Figure 3. In the second dataset, the maximum and minimum values of total chlorophyll content in Setaria are 0.35 and 0.10mg/g of fresh weight, respectively, with a difference of 0.25mg/g. The greatest and minimum values for Chl a are 0.26 and 0.08, respectively, while those for Chl b are 0.14 and 0.008 mg/g of fresh weight, as shown in Figure 5. Figure 4 shows the maximum and minimum total chlorophyll content values in Chloris gayana are 0.36 and 0.16mg/g, respectively, with a difference of 0.20mg/g. The greatest and minimum values for Chl (a) are 0.27 and 0.12, respectively, while those for Chl (b) are 0.17 and 0.02 as shown in Figure 4. According to the results the maximum values under no stress conditions, followed by normal, severe, and lowest values in high severe conditions.
Table 4: Chlorophyll content 1st data of Chloris and Setaria.
|
ANOVA |
||||||
|
Sum of Sq. |
DF |
Mean Sq. |
F. |
Sig. |
||
|
Chl a Chloris |
B/w groups |
0.023 |
3 |
0.008 |
19.642 |
0.000 |
|
Within groups |
0.005 |
12 |
0.000 |
|||
|
Total |
0.028 |
15 |
||||
|
Chl b Chloris |
B/w groups |
0.017 |
3 |
0.006 |
12.478 |
0.001 |
|
Within groups |
0.005 |
12 |
0.000 |
|||
|
Total |
0.022 |
15 |
||||
|
T Chl Chloris |
Between groups |
0.077 |
3 |
0.026 |
242.401 |
0.000 |
|
Within groups |
0.001 |
12 |
0.000 |
|||
|
Total |
0.078 |
15 |
||||
|
Chl a Setaria |
Between groups |
0.024 |
3 |
0.008 |
33.530 |
0.000 |
|
Within groups |
0.003 |
12 |
0.000 |
|||
|
Total |
0.027 |
15 |
||||
|
Chl b Setaria |
Between groups |
0.031 |
3 |
0.010 |
24.737 |
0.000 |
|
Within groups |
0.005 |
12 |
0.000 |
|||
|
Total |
0.036 |
15 |
||||
|
T Chl Setaria |
Between groups |
0.106 |
3 |
0.035 |
193.471 |
0.000 |
|
Within groups |
0.002 |
12 |
0.000 |
|||
|
Total |
0.108 |
15 |
||||
Several tillers and leaves are also reduced in high-stress conditions compared to normal conditions. Figures 6 and 7, demonstrate the relationship between different treatments and the total number of leaves and tillers. Figure 6 shows that Chloris gayana has a maximum and minimum number of leaves of 41 and 9, respectively, which is higher compared to Setaria anceps, which has maximum and minimum values of 29 and 7, as shown in Figure 7. Figure 6 displays the number of tillers per stem, which is 8 and 2 for Chloris gayana, compared to 6 and 2 for Setaria anceps, as shown in Figure 7. All these comparisons suggest that Chloris gayana grass generally performs better than Setaria anceps under normal, moderate, severe, and high-severe conditions. In 2nd dataset, the maximum and minimum number of leaves for Chloris gayana grass are 42 and 07, while the maximum and minimum number of tillers are 08 and 02, as shown in Figure 8. Setaria anceps has a maximum and minimum number of leaves of 30 and 07, while the number of tillers ranges from 06 to 02 as illustrated in Figure 9. However, data analysis depicted that, Chloris gayana demonstrates higher resilience under severe conditions.
The height of the plant is highly reduced in severe and highly severe conditions. Figures 10 and 11 demonstrated the relationship between treatments and the height of Setaria and Chloris gayana grass. In 1st dataset, Chloris gayana has the greatest and lowest height of 4 and 2.4ft, respectively, as illustrated in Figure 10. Setaria grass has a maximum height of 3.2 ft and a minimum height of 1.9 ft, as illustrated in Figure 11. These findings showed that Chloris gayana
height is less affected than Setaria anceps in all situations. In 2nd dataset, Figure 12 illustrates the maximum and minimum heights for Chloris gayana are 4.4 ft and 2.5 ft, respectively. While Setaria anceps, the highest and lowest heights are 3.4 ft and 1.9 ft, respectively, depicted in Figure 13. These findings indicate that the height of Chloris gayana is not significantly reduced compared to Setaria anceps under identical conditions. The prolonged duration of stress affects the height of both species, although Chloris gayana is more resistant to extreme conditions.
Dry biomass and fresh weight is highest in normal conditions compared to extreme conditions. Figures 14 and 15 exhibited the relationship between different stress levels and the biomass of Chloris gayana and Setaria anceps. Figure 13 depicts maximum and minimum biomass values being 9 and 2g, respectively. On the other hand, Figure 14 illustrates the maximum and minimum biomass values being 8 and 2 g. These statistics show that the biomass is relatively higher in Chloris gayana compared to Setaria anceps.
Increasing temperature and limited water had a substantial effect on the growth and productivity of plants. Soil moisture content (SMC) was observed in both species. SMC decreased with increasing stress levels: 100% FC at 25°C, followed by 75% FC at 30°C, 50% FC at 35°C, and 25% FC at 40°C, as shown in Table 1. This decrease in SMC is due to increased evapotranspiration, reduced water retention, and increased plant water uptake (Luo et al., 2010). Thus, Chloris gayana did not change as much as Setaria anceps under high-stress conditions. These results are comparable with those of (Singh and Suthar, 2014). Relative water content (RWC) was highest under normal conditions and lowest under severe stress in both species. As the stress period increased, the impact on RWC became more severe, overall, the RWC in severe conditions decreased to 50% from that of 1st data which was 55 and 56 %, as shown in Table 3. However, Chloris gayana grass performed better under severe conditions compared to Setaria anceps shown in Tables 2 and 3. This outcome proposes that Setaria anceps is comparatively less resilient than Chloris gayana in severe and high severe conditions. When enough water is not available to plant and plants started drying and ultimately dead. The decreased RLWC is due to reduced leaf water potential, and these results are supported by the research of (Farkhondeh et al., 2012).
The highest chlorophyll content of both species was noted in normal conditions or no stress conditions and started declining in moderate, severe, and high-stress conditions. Furthermore, prolonged and severe conditions of heat and drought highly reduced the chlorophyll content in both species, however, Chloris gayana slightly showed high chlorophyll content in extreme conditions as compared to Setaria anceps as shown in Figures 4 and 5. Chlorophyll content directly affect the photosynthetic activity as chlorophyll content is responsible for the efficiency of photosynthetic activity and overall growth in plants. The decrease in chlorophyll content under stress conditions is a prominent event that varies among different plants (Ashraf, 2004). Chlorophyll content is imperative to photosynthetic activity, and my results are consistent with those of (Wang et al., 2017).
The total number of leaves and tillers per plant also decreased under moderate, severe, and highly severe treatments compared to the normal or no-stress treatments. Furthermore Chloris gayana had higher number of leaves and tillers compared to Setaria anceps as depicted in Figures 6 and 7. Rising temperatures and drought adversely affected both the number of tillers and leaves under prolonged stress, as shown in Figures 8 and 9. Tillers and leaves indicated the overall productivity of pants. However, Chloris gayana grass performed slightly better than Setaria anceps because Chloris gayana is more resistant than Setaria anceps (Ponsens et al., 2010). Results showed that plant height and biomass are also adversely affected under severe conditions. Results depicted that plant height is highly reduced under severe conditions in both species. However, Chloris gayana was less affected, with maximum and minimum heights of 4.4 and 2.4 ft. as compared to Setaria anceps shown in Figures 10 and 11. As the stress period increased, the maximum and minimum heights did not increase significantly. In the second dataset, height of both species was significantly reduced compared to 1st data set which indicated that, time period of extreme conditions highly reduced plant height. These findings are by (Kiliç and Yağbasanlar, 2010).
Abiotic stresses, such as rising temperatures and drought, limit overall plant productivity (Lipiec et al., 2013). Results showed that plant biomass is also reduced under stress compared to normal conditions. The maximum and minimum biomass of Chloris gayana were 9 and 2 grams, respectively, while for Setaria anceps, the maximum and minimum biomass were 8 and 2 grams, respectively, as shown in Figures 14 and 15. These results are comparable with the findings of (Zlatev and Lidon, 2012).
Conclusions and Recommendations
This study found that heat and drought stress had a substantial effect on the development of grass species. The findings revealed that increasing temperature and drought stress had an impact on growth parameters such as chlorophyll, soil moisture, relative leaf water, plant height, and biomass in both Setaria anceps and Chloris gayana (Rhode grass) under severe and extremely severe conditions. Further research demonstrated that Chloris gayana slightly outperformed Setaria anceps, especially under severe and extremely severe circumstances. These findings will help shape future research on important topics. Based on the findings, Chloris gayana is suggested for places with heat and drought stress.
Acknowledgements
We would like to express our heartfelt gratitude to the chairman of the Department of forestry and Range Management, faculty of agriculture, PMAS Arid Agriculture University Rawalpindi, and to Dr. Saeed Gulzar, Assistant professor Department of forestry and range management at PMAS Arid Agriculture University Rawalpindi, for their support in allowing us to conduct this experiment in forest forestry and for providing the necessary equipment to carry out this research.
Novelty Statement
The combined effect of heat and drought stress and their impact on the physiological and morphological parameters simultaneously on Chloris gayana and Setaria anceps have not been explored yet. This provides valuable insight for future studies and forage management of given species.
Author’s Contribution
Touseeq Haider: Conducted research, data collection, analysis and wrote this manuscript.
Saeed Gulzar: Supervised the research.
Sabeeqa Usman Malik: Helped in manuscript drafting.
Aamir Saleem: Helped in proofreading.
Zuhair Hasnain: Improved contents of the manuscript.
Nazakat Hussain: Assisted in data analysis.
Syed Ali Abbas: Helped in data collection.
Amir Hussain: Helped in data collection phase 2.
Qadir Hussain: Assisted in format setting and analysis.
Statement of conflict of interest
The authors have declared no conflict of interest.
References
Ahmad, I., M.S.A. Ahmad, M. Hussain, M. Ashraf, M.Y. Ashraf and M. Hameed. 2010. Spatiotemporal aspects of plant community structure in open scrub rangelands of sub mountainous Himalayan plateaus. Pak. J. Bot., 42(5): 3431-3440.
Arshadullah, M., J. Afzal, M. Anwar, S.N. Mirza and M. Rasheed. 2012. Forage production and nutritional quality of grasses in mesic climate of Pothwar Plateau, Rawalpindi. J. Anim. Plant Sci., 22(3): 781-784.
Ashraf, M., 2004. Some important physiological selection criteria for salt tolerance in plants. Flora Morphol. Distrib. Funct. Ecol. Plants, 199(5): 361-376. https://doi.org/10.1078/0367-2530-00165
Asseng, S., I.A.N. Foster and N.C. Turner. 2011. The impact of temperature variability on wheat yields. Glob. Change Biol., 17(2): 997-1012. https://doi.org/10.1111/j.1365-2486.2010.02262.x
Challinor, A.J., J. Watson, D.B. Lobell, S.M. Howden, D.R. Smith and N. Chhetri. 2014. A meta-analysis of crop yield under climate change and adaptation. Nat. Clim. Change, 4(4): 287-291. https://doi.org/10.1038/nclimate2153
Farkhondeh, R., R.E. Nabizadeh and N. Jalilnezhad. 2012. Effect of salinity stress on proline content, membrane stability and water relations in two sugar beet cultivars. Int. J. Agric. Crop Sci., 2(5): 385-392.
Friedlingstein, P., R.A. Houghton, G. Marland, J. Hackler, T.A. Boden, T.J. Conway and C. Le Quéré. 2010. Update on CO2 emissions. Nat. Geosci., 3(12): 811-812. https://doi.org/10.1038/ngeo1022
Hussain, M., M.A. Malik, M. Farooq, M.Y. Ashraf and M.A. Cheema. 2008. Improving drought tolerance by exogenous application of glycinebetaine and salicylic acid in sunflower. J. Agron. Crop Sci., 194(3): 193-199. https://doi.org/10.1111/j.1439-037X.2008.00305.x
Imaz, J.A., D.O. Giménez, A.A. Grimoldi and G.G. Striker. 2015. Ability to recover overrides the negative effects of flooding on growth of tropical grasses Chloris gayana and Panicum coloratum. Crop Pasture Sci., 66(1): 100-106. https://doi.org/10.1071/CP14172
IPCC, 2018. Summary for policymakers. Geneva, Switzerland: World Meteorological Organization. https://www.ipcc.ch/sr15/download/#full.
Jazi, Z.G., N. Etemadi and H. Aalipour. 2019. The physiological responses of four turfgrass species to drought stress. Adv. Hortic. Sci., 33(3): 381-390.
Jiang, Y. and B. Huang. 2001. Physiological responses to heat stress alone or in combination with drought: A comparison between tall fescue and perennial ryegrass. Hortic. Sci., 36(4): 682-686. https://doi.org/10.21273/HORTSCI.36.4.682
Kiliç, H. and T. Yağbasanlar. 2010. The effect of drought stress on grain yield, yield components and some quality traits of durum wheat (Triticum turgidum ssp. durum) cultivars. Notulae Botanicae Hortic. Agrobot. Cluj-Napoca, 38(1): 164-170.
Lal, R., 2004. Soil carbon sequestration to mitigate climate change. Geoderma, 123(1-2): 1-22. https://doi.org/10.1016/j.geoderma.2004.01.032
Lipiec, J., C. Doussan, A. Nosalewicz and K. Kondracka. 2013. Effect of drought and heat stresses on plant growth and yield. A review. Int. Agrophys., 27(4): 463-477. https://doi.org/10.2478/intag-2013-0017
Luo, Y., O.J. Sun and X. Zhou. 2010. Elevated CO2 increases belowground respiration in hardwood forest. New Phytol., 154(2): 431-440.
Milbau, A., L. Scheerlinck, D. Reheul, B. De Cauwer and I. Nijs. 2005. Ecophysiological and morphological parameters related to survival in grass species exposed to an extreme climatic event. Physiol. Plant., 125(4): 500-512. https://doi.org/10.1111/j.1399-3054.2005.00586.x
Nelimor, C., B. Badu-Apraku, A.Y. Tetteh and A.S. N’guetta. 2019. Assessment of genetic diversity for drought, heat and combined drought and heat stress tolerance in early maturing maize landraces. Plants, 8(11): 518. https://doi.org/10.3390/plants8110518
Okçu, G., M.D. Kaya and M. Atak. 2005. Effects of salt and drought stresses on germination and seedling growth of pea (Pisum sativum L.). Turk. J. Agric. For., 29(4): 237-242.
Ponsens, J., J. Hanson, J. Schellberg and B.M. Moeseler. 2010. Characterization of phenotypic diversity, yield and response to drought stress in a collection of Rhodes grass (Chloris gayana Kunth) accessions. Field Crops Res., 118(1): 57-72. https://doi.org/10.1016/j.fcr.2010.04.008
Porter, J.R., 2005. Rising temperatures are likely to reduce crop yields. Nature, 436(7048): 174-174. https://doi.org/10.1038/436174b
Riaz, A., A. Younis, M. Hameed and S. Kiran. 2010. Morphological and biochemical responses of turf grasses to water deficit conditions. Pak. J. Bot., 42(5): 3441-3448.
Rizwan, M., S. Ali, B. Ali, M. Adrees, M. Arshad, A. Hussain, M.Z. Rehman and A.A. Waris. 2019. Zinc and iron oxide nanoparticles improved the plant growth and reduced the oxidative stress and cadmium concentration in wheat. Chemosphere, 214: 269–277. https://doi.org/10.1016/j.chemosphere.2018.09.120
Singh, G. and S. Suthar. 2014. Influence of irrigation and soil management on soil physical properties in cotton-wheat rotation of Indian semi-arid ecosystem. Int. J. Plant Prod., 8(2): 199-214.
Smith, J., A. Jones and T. Brown. 2010. Growth performance of Setaria anceps in tropical pastures. J. Trop. Agric., 45(3): 123-130.
Wahid, A., S. Gelani, M. Ashraf and M.R. Foolad. 2007. Heat tolerance in plants: An overview. Environ. Exp. Bot., 61(3): 199-223. https://doi.org/10.1016/j.envexpbot.2007.05.011
Wang, J., P. Burgess, S.A. Bonos, W.A. Meyer and B. Huang. 2017. Differential physiological responses and genetic variations in fine fescue species for heat and drought stress. J. Am. Soc. Hortic. Sci., 142(5): 367-375. https://doi.org/10.21273/JASHS04121-17
Wassie, M., W. Zhang, Q. Zhang, K. Ji and L. Chen. 2019. Effect of heat stress on growth and physiological traits of alfalfa (Medicago sativa L.) and a comprehensive evaluation for heat tolerance. Agronomy, 9(10): 597. https://doi.org/10.3390/agronomy9100597
Zhou, R., X. Yu, C.O. Ottosen, E. Rosenqvist, L. Zhao, Y. Wang and Z. Wu. 2017. Drought stress had a predominant effect over heat stress on three tomato cultivars subjected to combined stress. BMC Plant Biol., 17(1): 1-13. https://doi.org/10.1186/s12870-017-0974-x
Zlatev, Z. and F.C. Lidon. 2012. An overview on drought induced changes in plant growth, water relations and photosynthesis. Emirates J. Food Agric., 24(1): 57-72. https://doi.org/10.9755/ejfa.v24i1.10599
To share on other social networks, click on any share button. What are these?