
Fecal Calprotectin Concentrations and Other Indicators in Dogs with Idiopathic Inflammatory Bowel Disease


Fecal Calprotectin Concentrations and Other Indicators in Dogs with Idiopathic Inflammatory Bowel Disease
Heba El-Zahar*, Zeinab Abd El-Rahman, Abbas El-Naggar
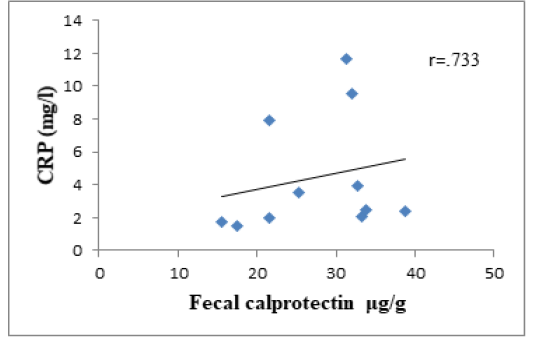
The correlation between serum CRP and fecal calprotectin in IBD dogs. The graph illustrates a strong positive correlation (r = 0.733) between CRP in mg/l and fecal calprotectin μg/g r = Pearson correlation coefficient.
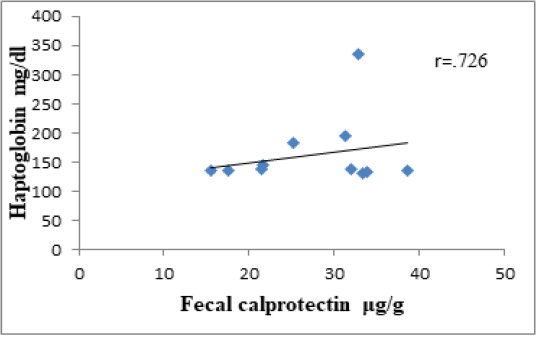
The correlation between serum haptoglobin and fecal calprotectin in IBD dogs. The graph illustrates a strong positive correlation (r = 0.726) between haptoglobin in mg/dl and fecal calprotectin μg/g r = Pearson correlation coefficient.
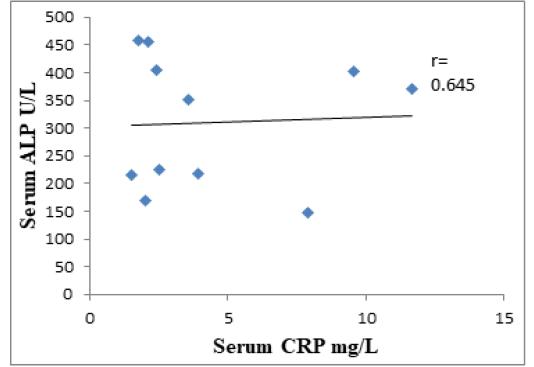
The correlation between serum ALP and CRP in IBD dogs. The graph illustrates a moderately positive correlation (r = 0.645) between ALP U/l and CRP mg/l, r = Pearson correlation coefficient.
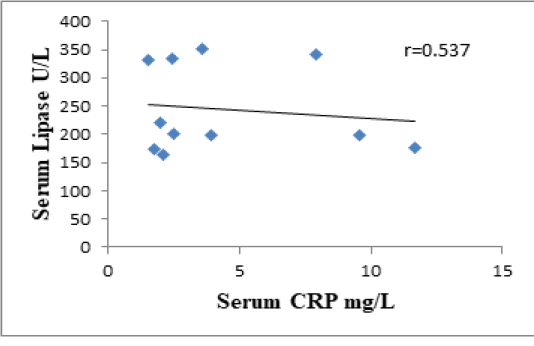
The correlation between serum Lipase and CRP in IBD dogs. The graph illustrates a moderately positive correlation (r = 0.537) between Lipase U/l and CRP mg/l, r = Pearson correlation coefficient.
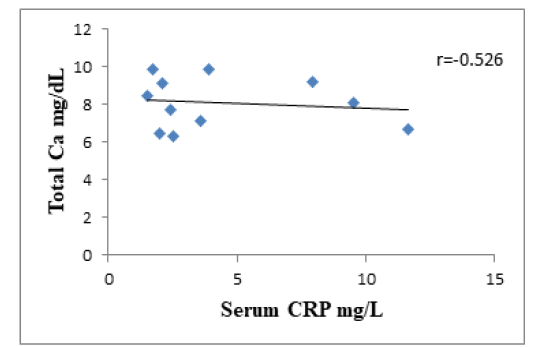
The correlation between serum total calcium and CRP in IBD dogs. The graph illustrates a moderately negative correlation (r = -0.526) between total Ca mg/dl and CRP mg/l, r = Pearson correlation coefficient.
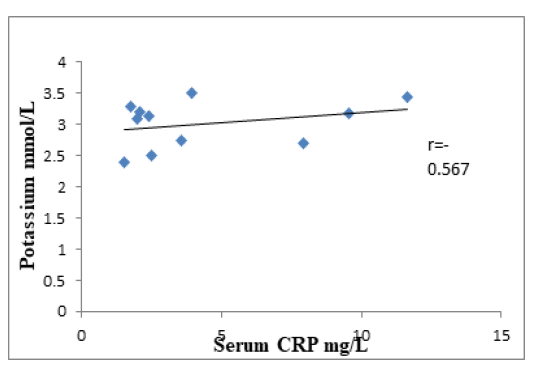
The correlation between serum plasma K+ and CRP in IBD dogs. The graph illustrates a moderately negative correlation (r = -0.526) between K+ mmol/l and CRP mg/l, r = Pearson correlation coefficient.
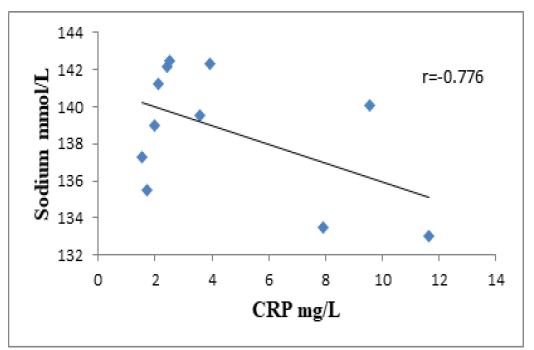
The correlation between serum plasma Na+ and CRP in IBD dogs. The graph illustrates a strong negative correlation (r = -0.776) between Na+ mmol/l and CRP mg/l, r = Pearson correlation coefficient.
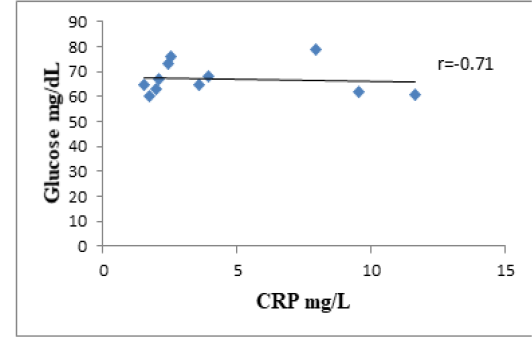
The correlation between blood glucose and CRP in IBD dogs. The graph illustrates a strong negative correlation (r = -0.71) between blood glucose mg/dl and CRP mg/l, r = Pearson correlation coefficient.


