Ginsenoside Rh2 Reduces Inflammation of Ulcerative Colitis via Elevating microRNA-30a-5p
Suanyuan Zhang, Qing Ji, Xinglong Wu, Jinjing Wang, Jin Yao, Chengfang Li, Xiaorong Yang, Na Tan, Jing Yang and Hong Zheng*
Affiliated Hospital of Zunyi Medical University, Zunyi City, Guizhou Province, 563000, China
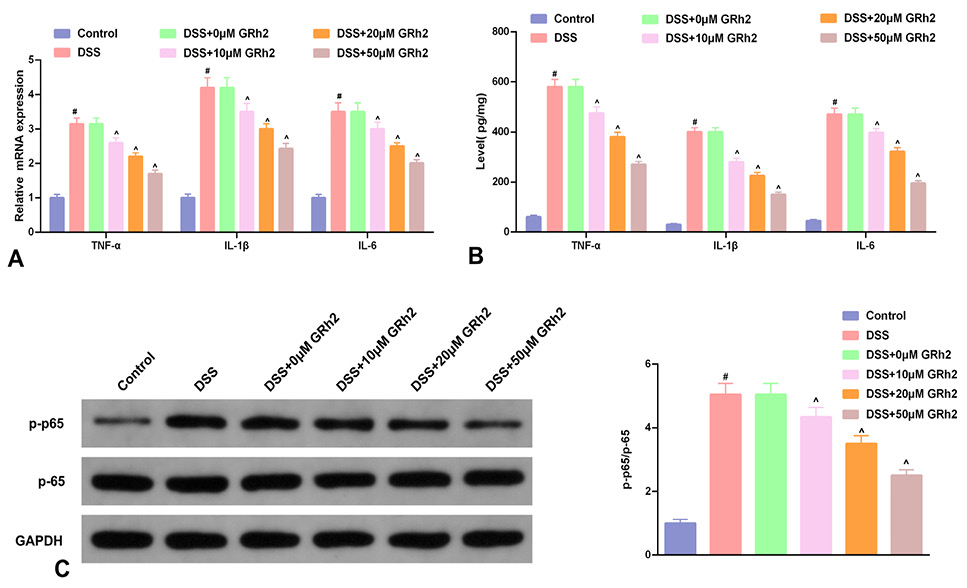
Fig. 1.
GRh2 represses inflammation and NF-κB pathway concentration-dependently. A, RT-qPCR detection of the relative TNF-α, IL-1β and IL-6 in NCM460 cells. B, ELISA detection the concentrations of TNF-α, IL-1β and IL-6 in the supernatant of NCM460 cell culture medium. C, WB detection of the ratio of NF-κB p-p65 to NF-κB p65 protein in NCM460 cells. A-C, introduction with GRh2 at a concentration of 0, 10, 20, and 50 μM. # P < 0.05, vs. the blank control in the DSS; ^ P < 0.05, vs. the DSS in the 10, 20, and 50 μM GRh2 treatment. No memorable difference was in the 0 μM GRh2 treatment and the DSS.
Fig. 2.
GRh2 concentration-dependently elevates NCM460 cell advancement. A, CCK-8 detection of the cell viability; B, Flow cytometry detection of the cell apoptosis. A-B, in NCM460 cells behind treatment with GRh2 at concentrations of 0, 10, 20, and 50 μM. Vs. the DSS, GRh2 at concentrations of 10, 20, and 50 μM memorably facilitated viability but inhibited the apoptosis of NCM460 cells. # P < 0.05, vs. the blank control in the DSS; ^ P < 0.05, vs. the DSS in the 10, 20, and 50 μM GRh2 treatment. No memorable difference was in the 0 μM GRh2 treatment and the DSS.
Fig. 3.
MiR-30a-5p is refrained in serum and tissues of active UC patients and NCM460 cells behind DSS treatment. A, RT-qPCR detection of the relative miR-30a-5p in the serum of active UC patients and healthy controls. Vs. healthy controls, miR-30a-5p was apparently reduced in the serum of active UC patients. B-C, RT-qPCR detection of the relative miR-30a-5p in colonic mucosal biopsies from active UC patients and healthy controls, and in normal or DSS-introduced NCM460 cells. * P < 0.05.
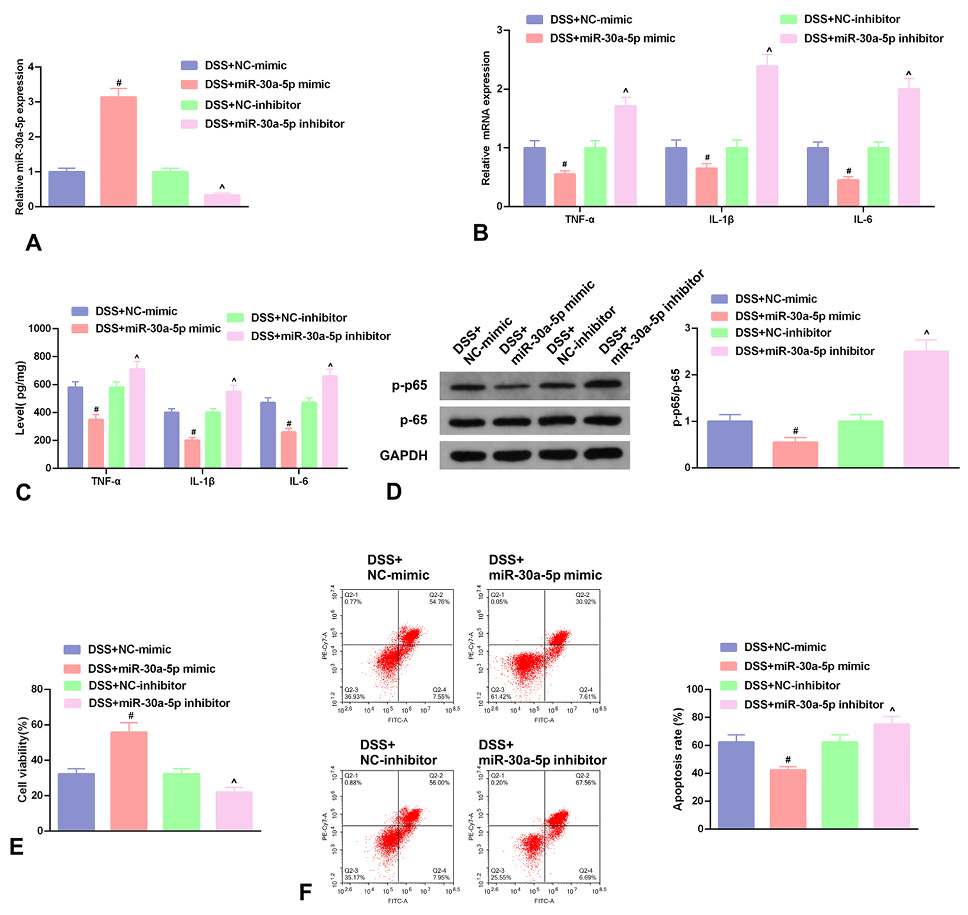
Fig. 4.
Enhancive miR-30a-5p restrains inflammation and NF-κB pathway, and strengthens NCM460 cell advancement. A, the relative miR-30a-5p in NCM460 cells introduced with miR-30a-5p mimic/inhibitor and NC-mimic/inhibitor. B, TNF-α, IL-1β and IL-6. A-B, RT-qPCR detection. C, ELISA detection the concentrations of TNF-α, IL-1β and IL-6 in cell culture medium. D, WB detection of the ratio of NF-κB p-p65 to NF-κB p65 protein. E, CCK-8 method detection of the cell viability. F, Flow cytometry detection of apoptosis. B-F, in introduced NCM460 cells. E-F, Elevated miR-30a-5p elevated cell viability but repressed cell apoptosis. # P < 0.05, vs. the NC mimic in the miR-30a-5p mimic; ^ P < 0.05, vs. the NC-inhibitor in the miR-30a-5p inhibitor.
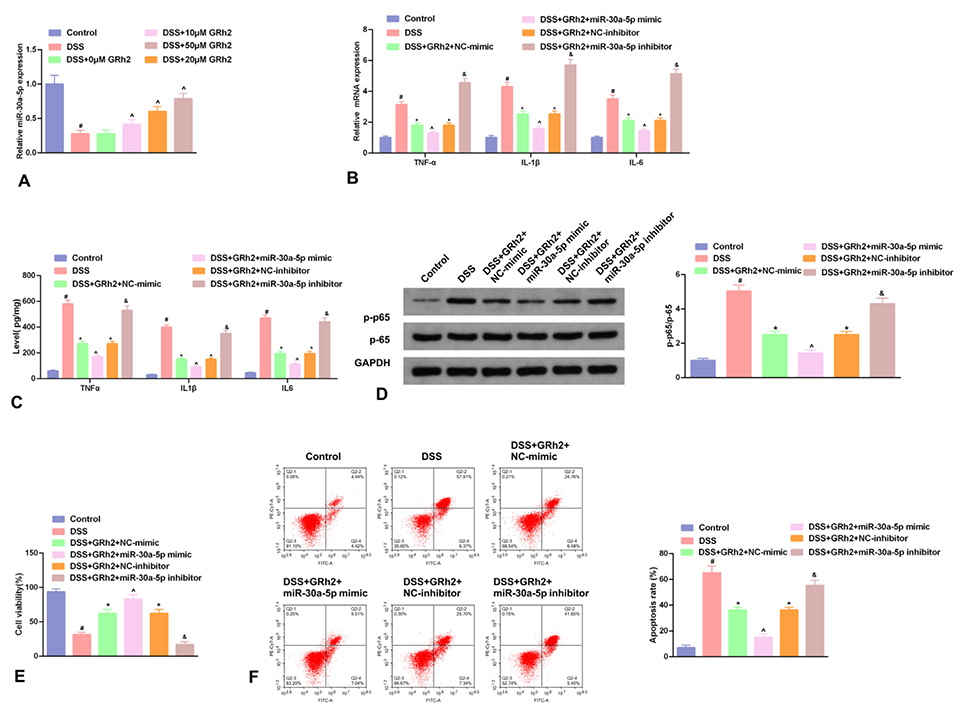
Fig. 5.
In NCM460 cells, GRh2 accelerates miR-30a-5p; Enhancive miR-30a-5p strengthens GRh2’s repression of inflammation and NF-κB pathway, and elevation of cell advancement. A, The relative miR-30a-5p in cells introduced with GRh2 at a concentration of 0, 10, 20, and 50 μM. B, TNF-α, IL-1β and IL-6 in cells introduced with 50 μM GRh2 and miR-30a-5p/NC mimic/inhibitor. A-B, RT-qPCR detection. C, ELISA detection the concentrations of TNF-α, IL-1β and IL-6 in cell culture medium. D, WB detection of the ratio of NF-κB p-p65 to NF-κB p65 protein. E, CCK-8 method detection of the cell viability. F, Flow cytometry detection of apoptosis. A-F, in NCM460 cells. C-F, behind GRh2 introduction and transfection. # P < 0.05, vs. the blank control in the DSS; *P < 0.05, vs. the NC mimic/inhibitor in the DSS; ^ P < 0.05, vs. the NC-mimic in the miR-30a-5p mimic; & P < 0.05, vs. the NC-inhibitor in the miR-30a-5p inhibitor.


