
Multivariate Clustering of Grapes Cultivars for Productivity and Quality Enhancement under Rainfed Conditions


Multivariate Clustering of Grapes Cultivars for Productivity and Quality Enhancement under Rainfed Conditions
Naveeda Anjum1, Muhammad Aqeel Feroze1, Rizwan Rafique2,3*, Monis Hussain Shah4, Tehseen Ashraf5, Muhammad Asim6, Bushra Zulfiqar6 and Muhammad Shahid Iqbal7
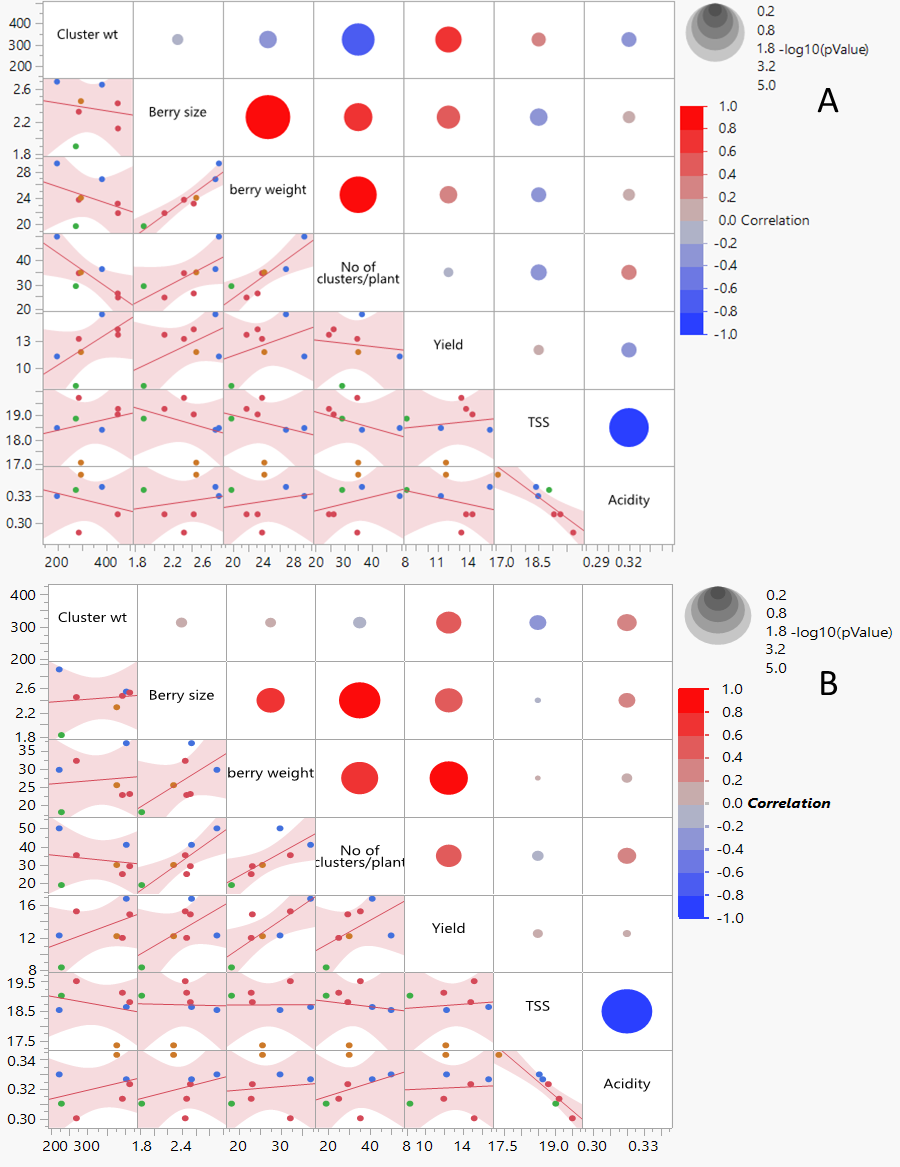
Scatterplot matrix for various yield and quality attributes in grapes under rain fed conditions for the year 2015 (A) and 2016 (B). The circle size indicates the strength of correlation. whereas as red circles indicate positive and blue circles indicate negative correlations.
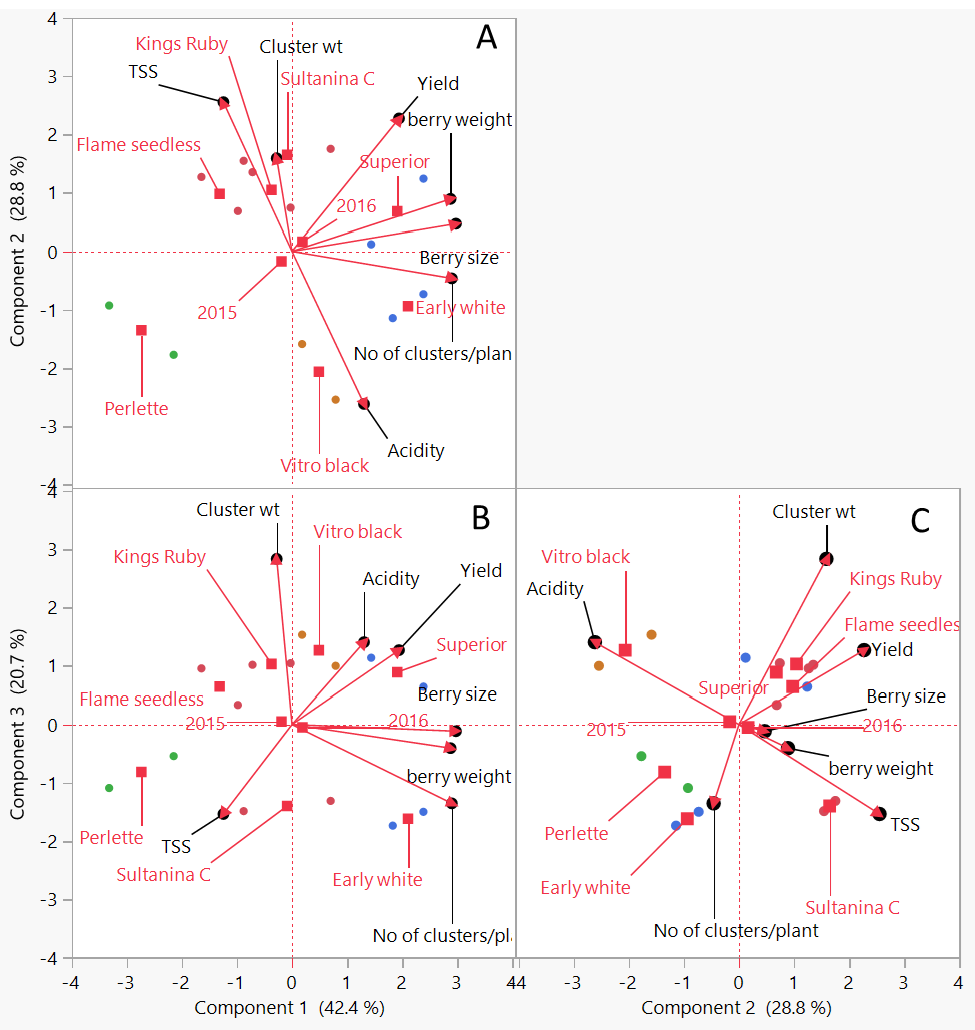
Biplot matrix of first three components; PC1 and PC2 (A), PC1 and PC3 (B) and PC2 and PC2 (C) for various yield and quality attributes in grapes under rain fed conditions across the years 2015 and 2016.
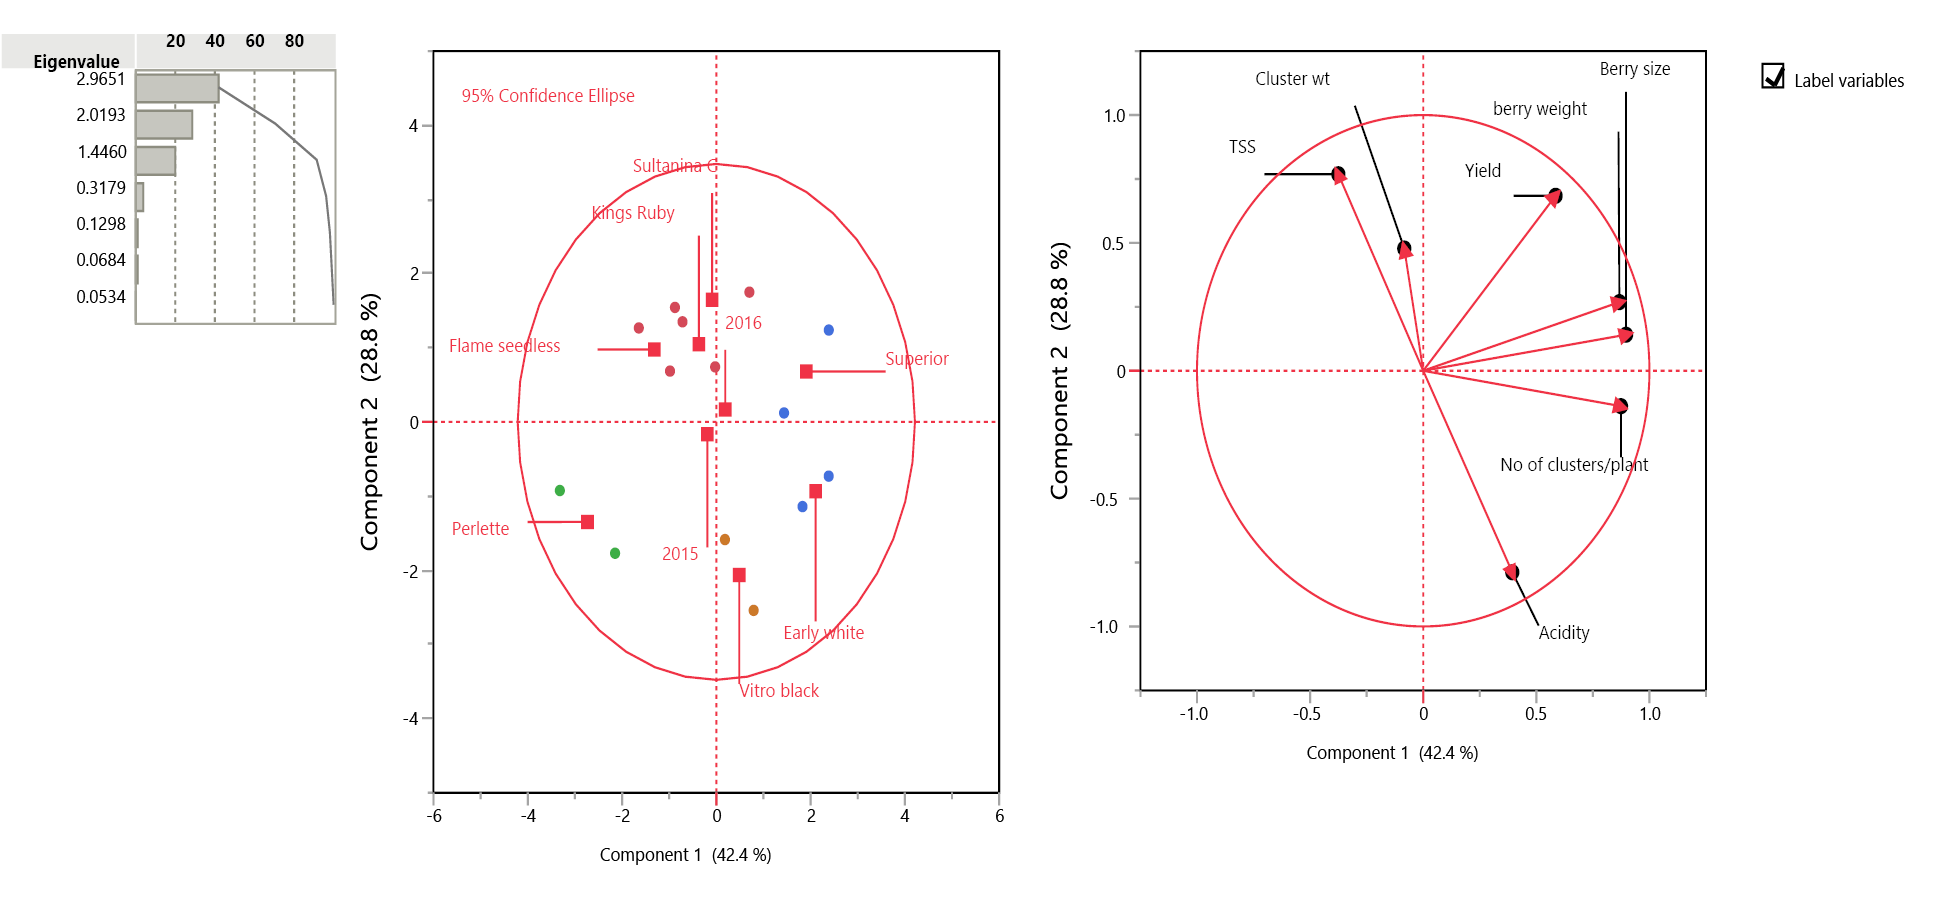
Summary plot of PCA for various yield and quality attributes in grapes under rain fed conditions across the years 2015 and 2016.
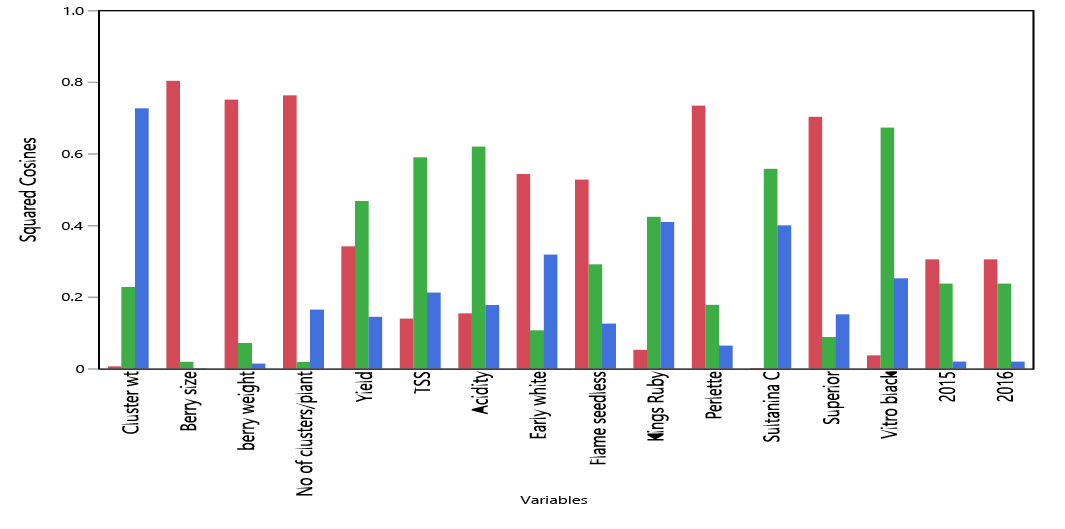
Plot of Squared Cosines for various yield and quality attributes in grapes under rain fed conditions across the years 2015 and 2016.
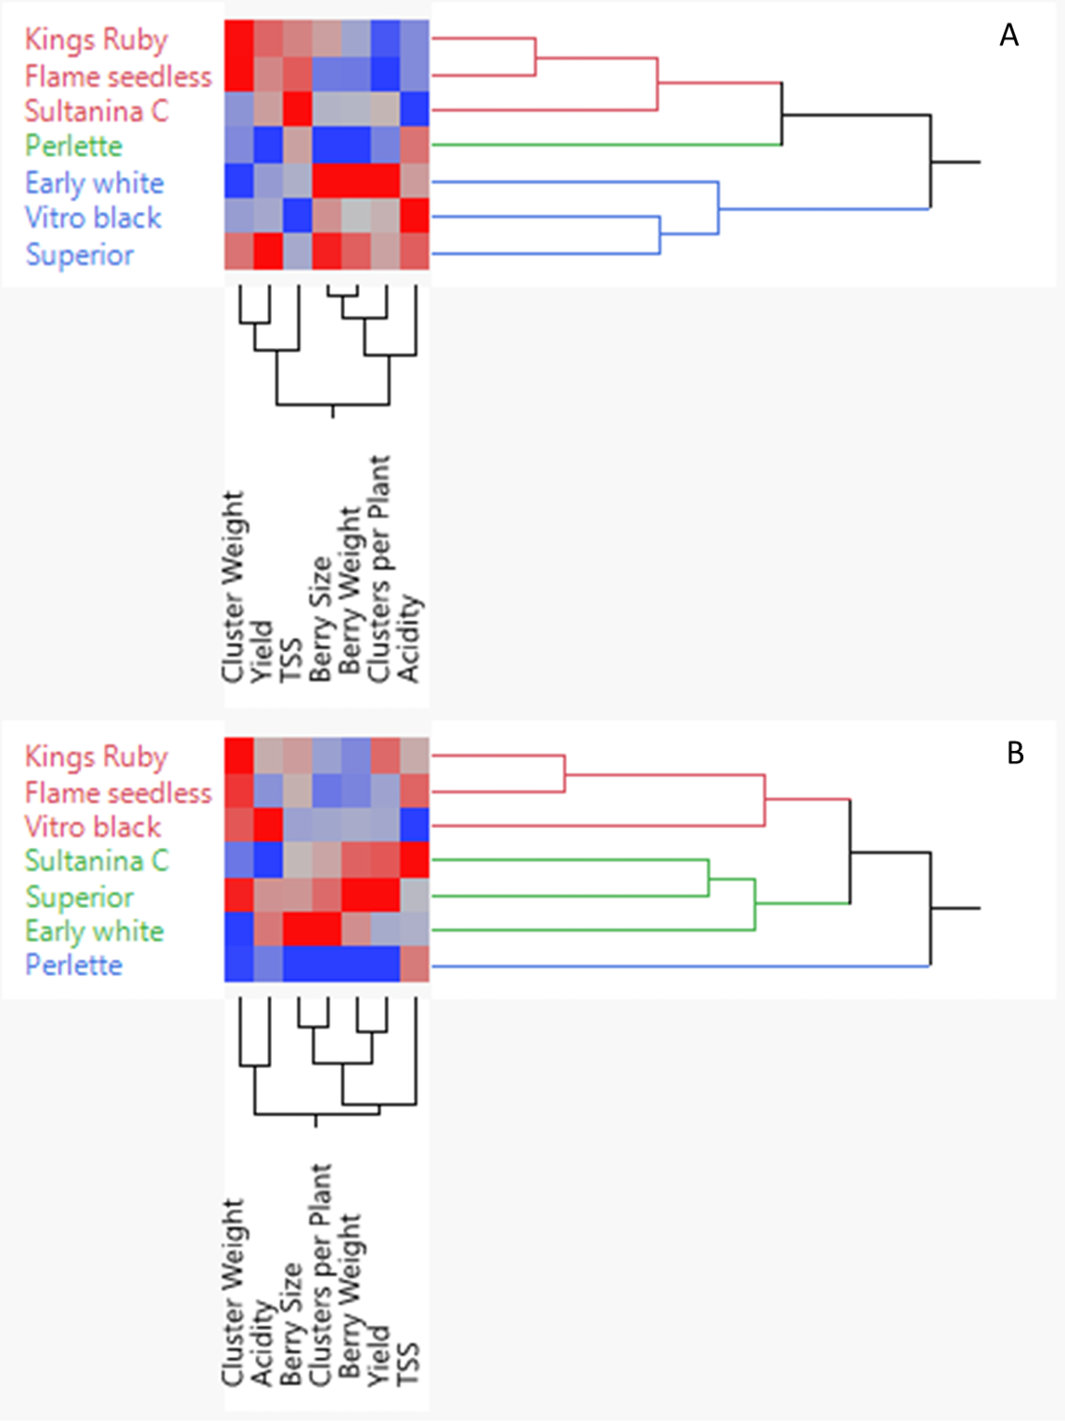
Hierarchical clustering for various yield and quality attributes in grapes cultivars under rain fed conditions for the year 2015 (A) and 2016 (B)


