Preparation of High Selenized Gastrodia elata Blume Polysaccharide and its Immunomodulatory Effects on RAW264.7 Cells and Cyclophosphamide-Treated Mice
Fengwei Ma1*, Qihua Wen1, Qingfang Deng2, Yihao Lu1, Buyan Zhang1, Yongyou Cheng1 and Su Xu1*
1College of Food Science and Engineering, Guiyang University, Guiyang 550005, China
2Key Laboratory for Information System of Mountainous Areas and Protection of Ecological Environment, Guizhou Normal University, Guiyang 550001, China
Fengwei Ma and Qihua Wen contributed equally to this work.
* Corresponding author: mfw200422501212@163.com, xs8515@126.com
Fig. 1.
Average MW (A, B), particle size distribution (C), and Zeta potential values (D) of GEP and Se-GEP.
MW, molecular weight; GEP, Gastrodia elata polysaccharide; Se-GEP, selenylation modification of sulfated GEP. The black lines in panels A and B represent good purity of polysaccharide, and the peaks were reflected in a corresponding MW in x-axis. The gray lines indicate the distribution plot of T-series dextran standards for establishing the MW range.
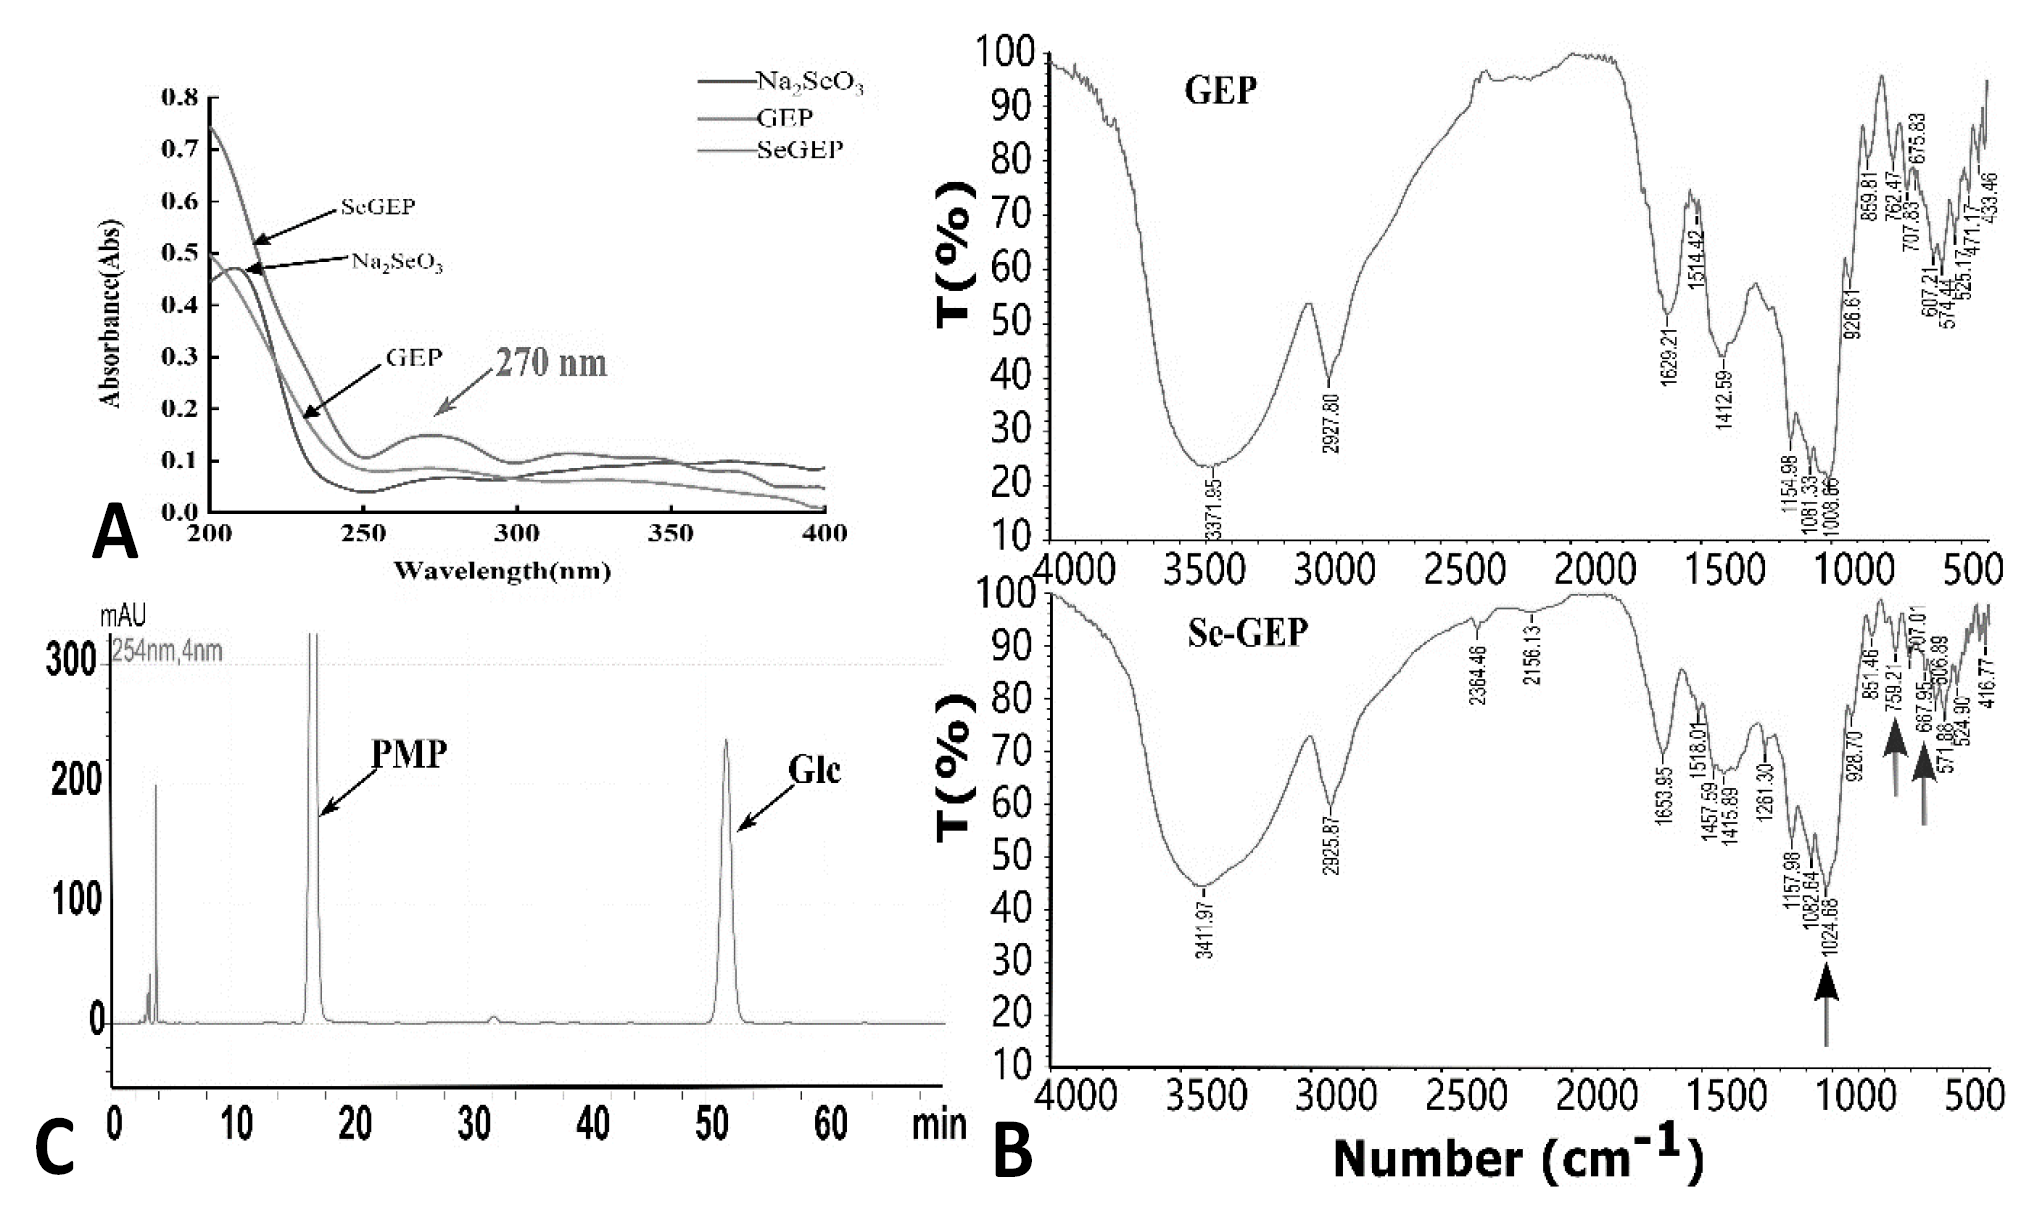
Fig. 2.
(A) UV spectra of GEP and Se-GEP recorded from 200-400 nm, (B) FT-IR spectra of GEP and Se-GEP measured in the frequency range of 4000~400 cm-1. (C) Chromatograms of monosaccharide composition analysis in GEP. UV, ultraviolet; FT-IR, Fourier-transform infrared spectra; PMP, 1-phenyl-3-methyl-5-pyrazolone; Glc, glucose. T (%), Transmittance (%).
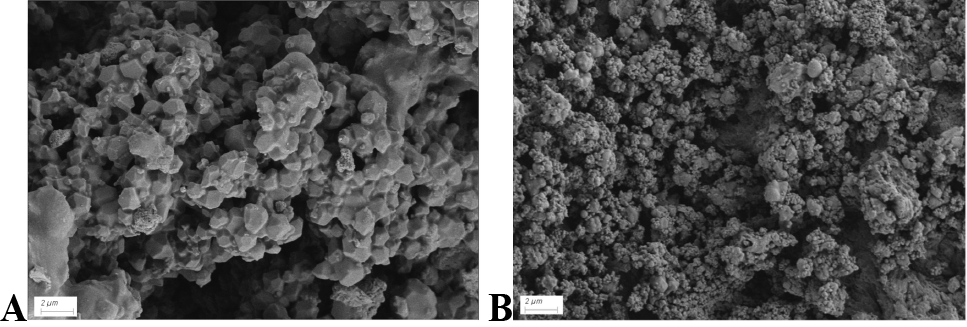
Fig. 3.
Morphological characterization of GEP (A) and Se-GEP (B) under scanning electron (×1000).
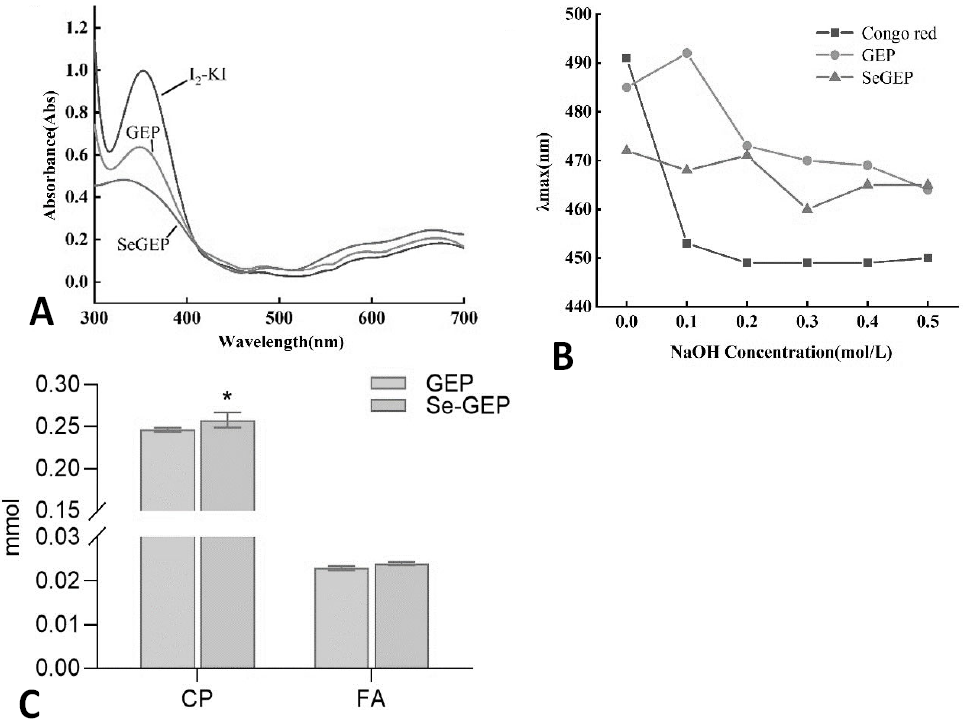
Fig. 4.
The I2-KI test of GEP and Se-GEP (A), the maximum absorption wavelength of Congo red test at various concentrations of NaOH (B), and the periodate consumption and formic acid formation of GEP and Se-GEP during periodate oxidation (C). CP, consumption of periodate, FA, formic acid formation.
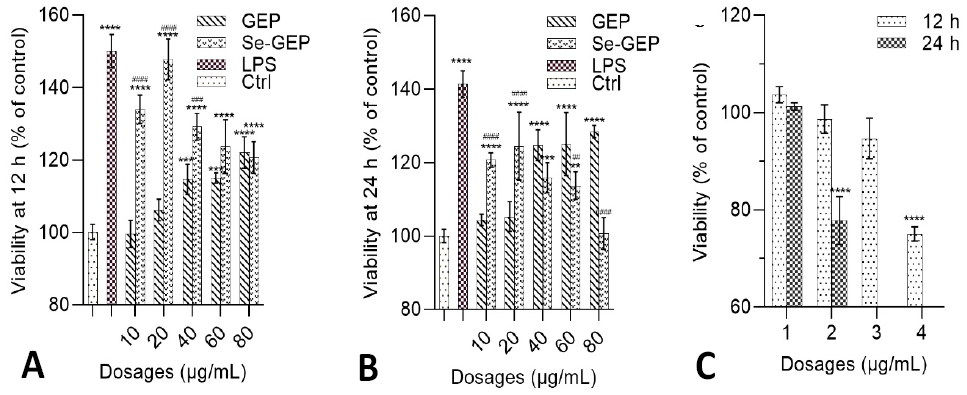
Fig. 5.
The viability of RAW264.7 cells exposed to GEP, Se-GEP or Na2SeO3.
Notes: (A, B) Exposure for 12 h (A) and 24 h (B). (C) Exposure to Na2SeO3 for 12 h and 24 h. The data are presented as mean ± SD. ** P < 0.01, *** P < 0.001, and **** P < 0.0001, compared with the negative control group. ## P < 0.01, ### P < 0.001, and #### P < 0.0001 compared between the GEP and Se-GEP groups. Ctrl, blank, negative control; LPS, Lipopolysaccharide, positive control; GEP, Gastrodia elata polysaccharide; Se-GEP, selenylation of sulfated GEP.
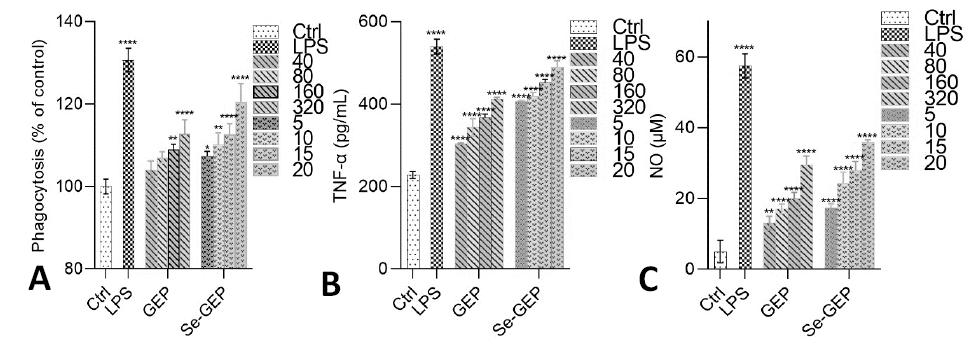
Fig. 6.
Phagocytosis activity analysis (A) and secretion levels of TNF-α (B) and NO (C) of RAW264.7 cells exposed to GEP and Se-GEP at different dosages for 24 h.
Notes: Ctrl, blank, negative control; LPS, lipopolysaccharide, 500 ng/mL, positive control; GEP at doses of 40, 80, 160, and 320 μg/mL; Se-GEP at doses of 5, 10, 15, and 20 μg/mL, respectively. TNF-α, tumor necrosis factor α; NO, nitric oxide. The data are presented as mean ± SD. * P < 0.05, ** P < 0.01, and **** P < 0.0001, compared with the negative control group.
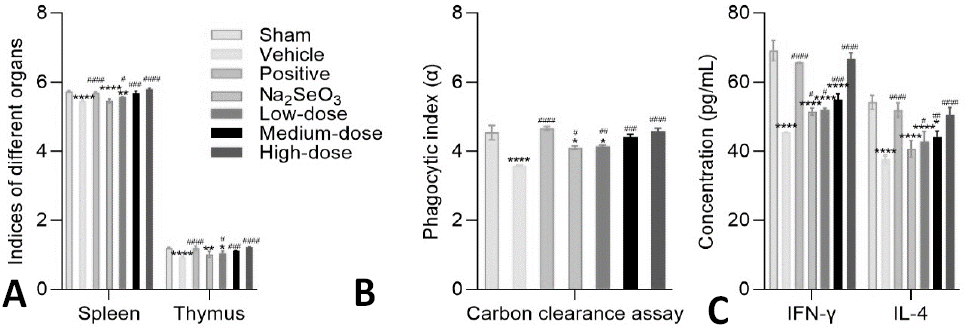
Fig. 7.
Effects of Se-GEP on spleen and thymus indexes (A), carbon clearance assay (B) and the level of serum IFN-γ and IL-4 (C).
Notes: IFN-γ, interferon gamma; IL-4, interleukin 4. Data are presented as mean ± SD. * P < 0.05, ** P < 0.01, and **** P < 0.0001, compared with the Sham control group. # P < 0.05, ## P < 0.01, ### P < 0.001, and #### P < 0.0001, compared with the vehicle group.


