
Sourcing Eco-Epidemiological Field Parameters to Describe a Slum Household-Based Pathogenic Leptospira Population Dynamics Simulation Model in Kenya: A Pseudo-Longitudinal Study Protocol


Sourcing Eco-Epidemiological Field Parameters to Describe a Slum Household-Based Pathogenic Leptospira Population Dynamics Simulation Model in Kenya: A Pseudo-Longitudinal Study Protocol
John Gachohi, Simon Karanja, Salome Wanyoike, Nduhiu Gitahi, Salome Bukachi, Kenneth Ngure


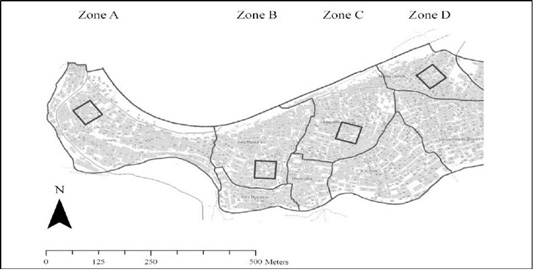
Map of the Kibera study for Leptospira infection in rodents (Halliday et al., 2013) and to be used for the proposed project. Small grey filled polygons indicate individual buildings / structure within the study site. Thick Grey boxes illustrate the location of the rodent trapping grids where Leptospira spp. were isolated. The scale and orientation of the figure is indicated (bottom left). Source: Halliday et al. (2013)
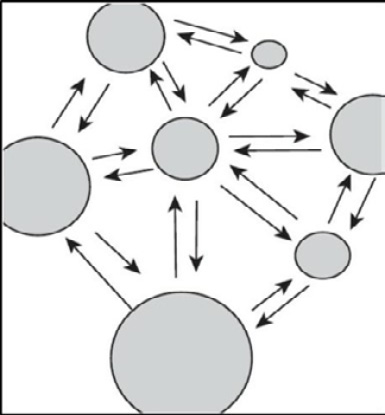
A diagrammatic illustration of a meta-population consisting of sub-populations (grey circles) interconnected by immigration (black arrows). Source: Hanski and Gilpin (1997)
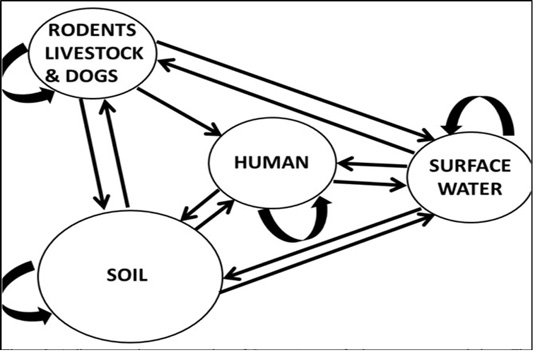
A diagrammatic illustration of Leptospira transfer between meta-population. The circles represent habitats where Leptospira can reside. Arrows represent migration rates between habitats with flow from habitat i to habitat j represented by mij. The large arrows indicate density-dependent exponential growth of bacteria within each habitat. NB: Rodent data will be sourced from the literature

