Age and Developmental Stage Dependent Changes in Plasma Concentrations of Growth Hormone and Testosterone and Linear Growth Velocity in Boys between the Age of 1 and 20 Years
Age and Developmental Stage Dependent Changes in Plasma Concentrations of Growth Hormone and Testosterone and Linear Growth Velocity in Boys between the Age of 1 and 20 Years
Afzaal Ahmad Naseem1*, Maleeha Akram1, Sarwat Jahan2, Kiran Afshan2, Zubaria Iqbal1, Faheem Tahir3, Mazhar Qayyum1 and Syed Shakeel Raza Rizvi1
Plasma concentrations of GH (open squares) and LGV (closed squares) in normal boys from 1 to 20 years of age.
Developmental stage dependent changes in GH (open squares) and LGV (closed squares) in normal boys from 1 to 20 years of age.
Age related changes in the mean plasma T concentrations (open squares) and LGV (closed squares) in boys between the ages of 1 and 20 years.
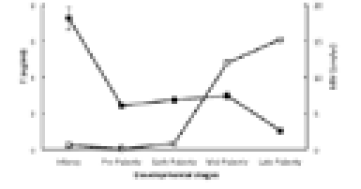
Correlation between the mean plasma concentrations of T (open squares) and LGV (closed squares) at infancy, pre-puberty, early, mid and late puberty in boys.
Age related changes in the mean plasma concentrations of GH (open squares) and T (closed squares) in boys between the ages of 1 and 20 years.
Plasma concentrations of GH (open squares) and T (closed squares) at infancy, pre-puberty, early, mid and late puberty/adolescence in boys.


