

Association Analysis of Polymorphism of FGFR1 and EBP41L5 Genes with Kidding Performance of Goats


Association Analysis of Polymorphism of FGFR1 and EBP41L5 Genes with Kidding Performance of Goats
Zhao Fulin1,2, Liang Chen2, Tao Lin1, Jiang Yanting3, Ouyang Yina3, Hong Qionghua3* and Chu Mingxing1*

FGFR1 and EPB41L5 gene locus genotyping results.
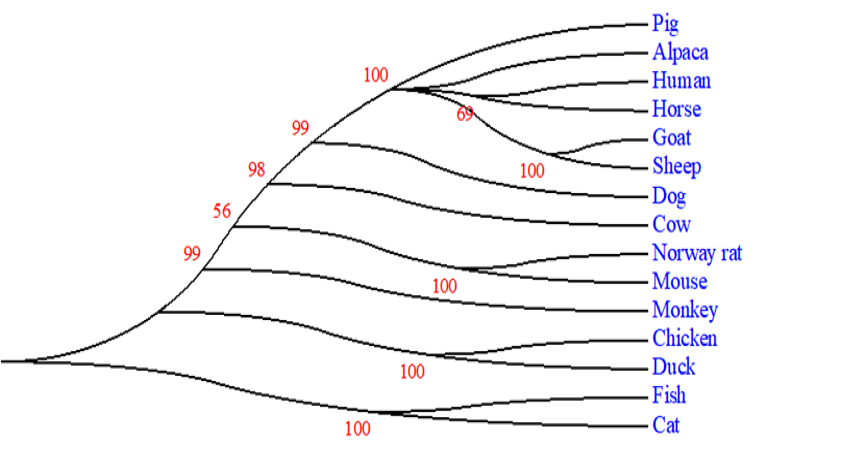
The phylogenetic tree of the EBP41L5 gene in different species.
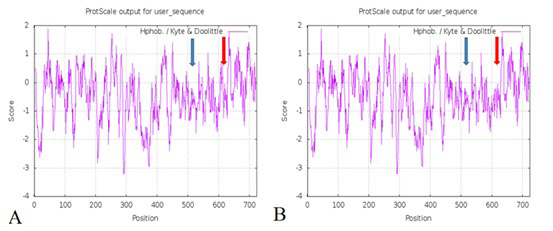
Hydrophobicity of EPB41L5 protein before and after mutation. (A) The hydrophobicity of the protein before mutation; (B) The hydrophobicity of the protein after mutation. Note: The blue arrow refers to the g. 64266710 G> C and g.64266715 G> C locus; the red arrow refers to the g. 64237881 A> C locus. The ordinate in the figure represents the hydrophobicity score of the protein. The area above the value of 0 is the hydrophobic area, and the area below the value of 0 is the hydrophilic area. The higher the score, the stronger the hydrophobicity of this area; the lower the score, the lower the hydrophobicity of this area. The abscissa represents the position of the amino acid.

The secondary structure of the protein and mRNA before and after the mutation at g. 64266710 G> C, g.64266715 G> C and g. 64237881 A> C. (A) Secondary protein structure before the mutation; (B) Secondary protein structure after the mutation; (C) mRNA secondary structure before the mutation; (D) mRNA secondary structure after the mutation. Note: The blue arrow refers to the g. 64266710 G> C and g.64266715 G> C locus; The red arrow refers to the g. 64237881 A> C locus.

