Complete Mitochondrial Genome and Phylogenetic Analysis of Gruiformes and Charadriiformes
Complete Mitochondrial Genome and Phylogenetic Analysis of Gruiformes and Charadriiformes
Peng Chen1,2, Zuhao Huang3,Chaoying Zhu1, Yuqing Han1, Zhifeng Xu1,
Guanglong Sun1, Zhen Zhang1, Dongqin Zhao4, Gang Ge1 and Luzhang Ruan1*
Mitochondrial genomes of four species.
Analysis of base content of complete mitochondrial genome of Gruiformes and Charadriiformes.
The mitochondrial genome base AT skew and GC skew of Gruiformes and Charadriiformes.
Analysis of base content of mitochondrial PCGs of Gruiformes and Charadriiformes.
The relative usage of stop codon of Gruiformes and Charadriiformes.
The relative usage of start codon of Gruiformes and Charadriiformes.
Frequency of mitochondrial PCGs amino acids of Gruiformes and Charadriiformes.
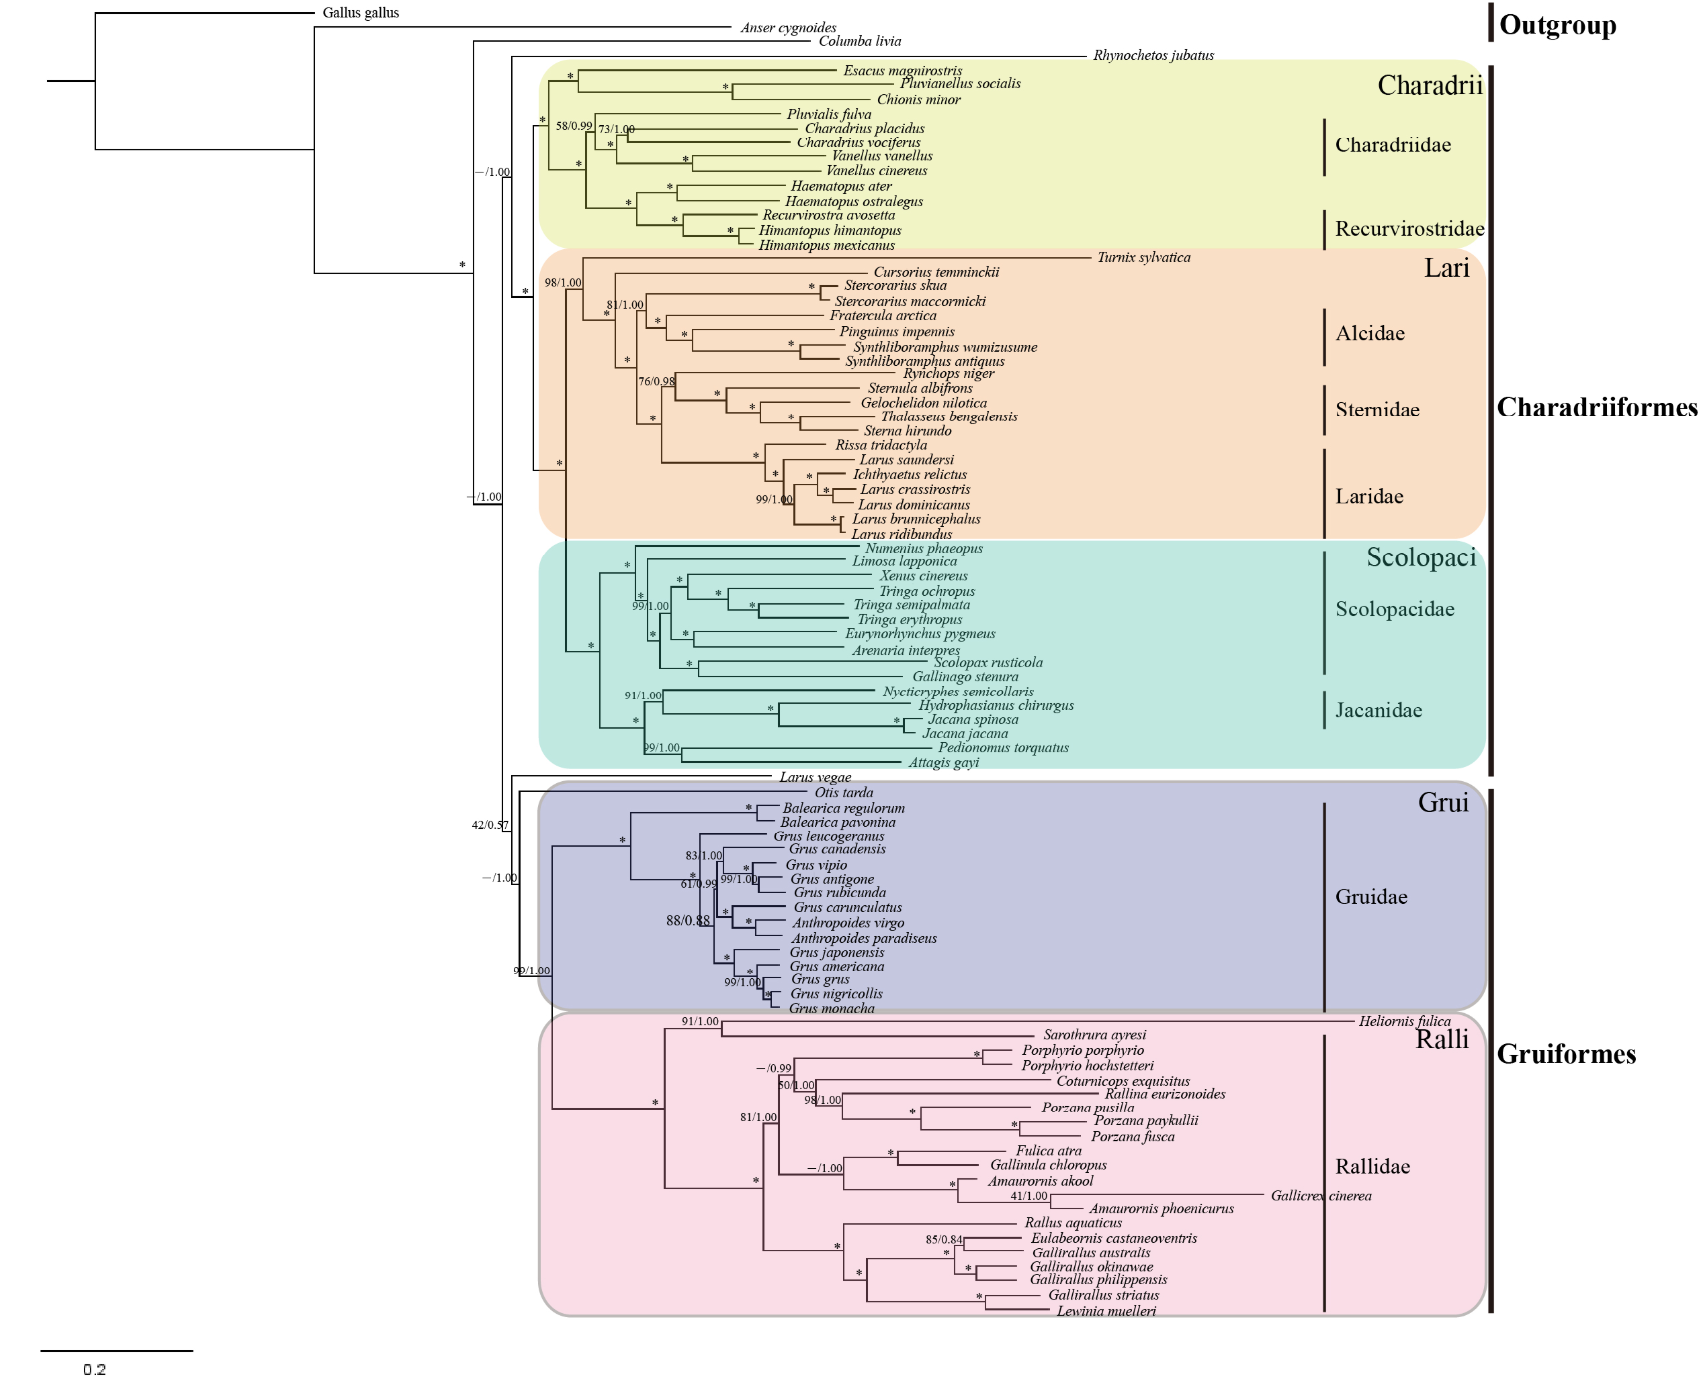
BI and ML trees constructed based on 12 PCGs and 2 rRNA genes of Gruiformes and Charadriiformes. Numbers represent bootstrap values (MP/ML) and only those > 40% are shown. Asterisks indicate posterior probabilities of 100%.
Analysis of divergence time based on 12 PCGs and 2 rRNAs genes of Gruiformes and Charadriiformes.


