

Detection of Expression Alteration of Cytokines in the Intestine of Balb/c Mice Infected with Cryptosporidium parvum using Relative Fluorescence Quantitative PCR Method


Detection of Expression Alteration of Cytokines in the Intestine of Balb/c Mice Infected with Cryptosporidium parvum using Relative Fluorescence Quantitative PCR Method
Liyun Chang1, Yingbin Chen1, Qian Kang1, JianhuaQin1,* and Zhiyong Liu2,*

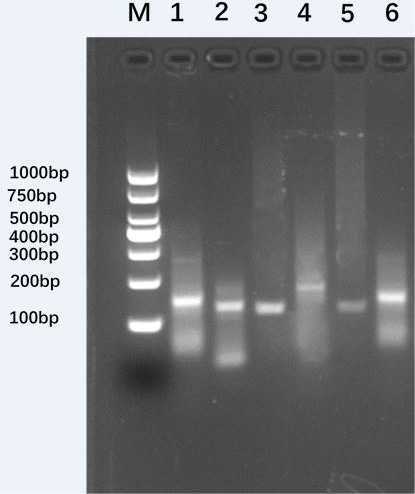
The electrophoresis result of primers of real-time RT-qPCR. M: DL-1000Marker; 1:IL-2 2:IL-4 3:IL-6 4: TNF-α 5: GAPDH 6: IFN-γ.

The amplification curves of GAPDH, IFN-γ, TNF-α, IL-2, IL-4 and IL-6. 1-5: The dilution factor is 1×10⁵-1×101 6: H2O.
The melting curves of GAPDH gene, IFN-γ, TNF-α, IL-2, IL-4 and IL-6.

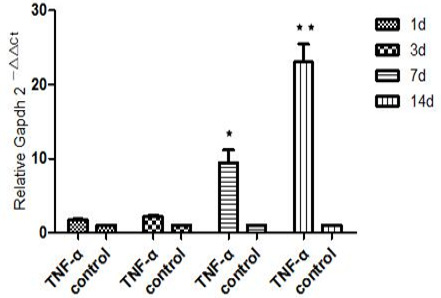
Relative expression of mouse cytokine TNF-α. *means P< 0.05, **means P< 0.01, ***means P< 0.001.

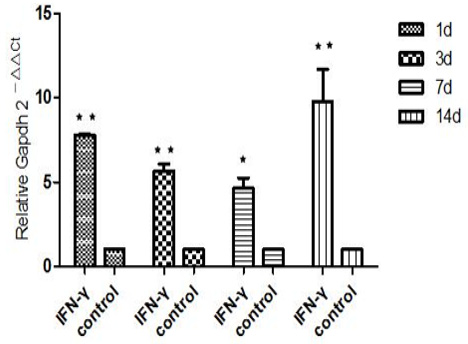
Relative expression of mouse cytokine TNF-γ. *means P< 0.05, **means P< 0.01, ***means P< 0.001.
Relative expression of mouse cytokine IL-2. *means P< 0.05, **means P< 0.01, ***means P< 0.001.
Relative expression of mouse cytokine IL-4. *means P< 0.05, **means P< 0.01, ***means P< 0.001.

Relative expression of mouse cytokine IL-6. *means P< 0.05, **means P< 0.01, ***means P< 0.001.

Relative expression of mouse cytokine IL-4. *means P< 0.05, **means P< 0.01, ***means P< 0.001.
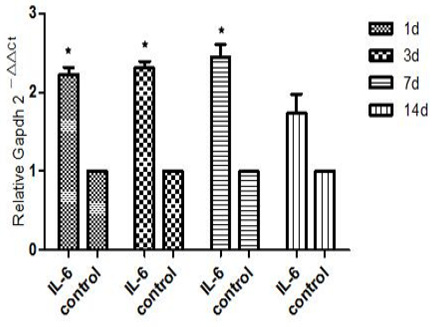
Relative expression of mouse cytokine IL-6. *means P< 0.05, **means P< 0.01, ***means P< 0.001.


