Effect of Inhibitor UNC0642 on Expression of G9a and Its Proliferative and Apoptotic Markers in Breast Cancer Cell Line MCF-7
Effect of Inhibitor UNC0642 on Expression of G9a and Its Proliferative and Apoptotic Markers in Breast Cancer Cell Line MCF-7
Afifa Yaqub1, Mehroze Amin1, Qindeel Fatima1, Rabail Hassan Toor1,3, Saira Aftab1 and Abdul Rauf Shakoori1,2*
Morphology of HEK-293 (A) and MCF-7 cell lines (B). Both of these cell lines show normal epithelial cells like morphology. Magnification: 10X.
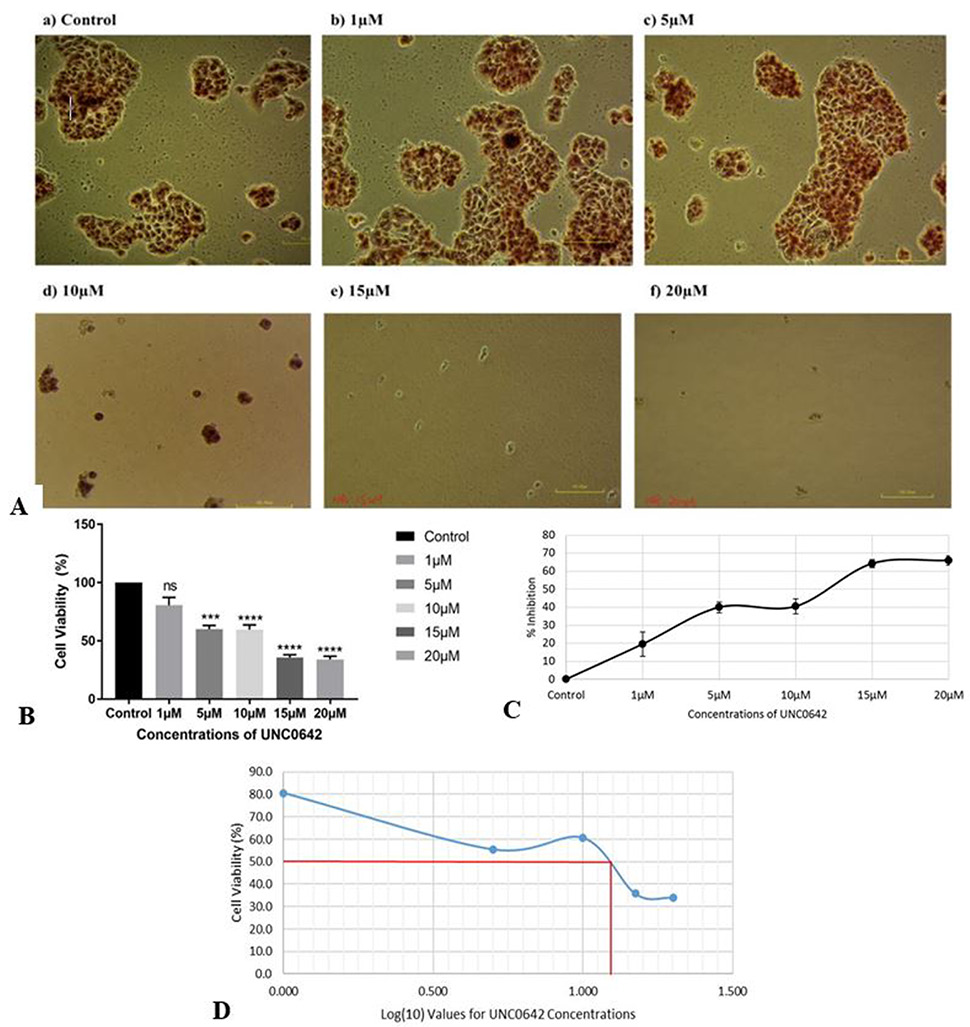
Effect of different concentrations of UNC0642 on the cell viability of MCF-7 cells (A) determined by Neutral Red assay. The control cells were given medium supplemented with 0.05 percent DMSO. (B) shows percentage cell viability. Taking control as 100 percent, the percentage cell viability was computed. GraphPad Prism (version 7) was used for statistical analysis, with one-way ANOVA and Dunnett’s test for multiple comparisons. The data were presented as a mean standard deviation of replicates. (P≥0.05; ns = not significant, *P≤0.05, **P≤0.01, P***≤0.001, ****P≤0.0001). (C) shows the percentage growth inhibition of MCF-7 cells treated with different concentrations of UNC0642. (D) shows logarithmic curve for determination of IC50 of UNC0642 by neutral red assay against the logarithmic values of the concentrations of UNC0642 selected for the present study. Determination of LC50 was done by calculating anti-log value for the value on x-axis (anti-log 1.1) against 50% cell viability (as indicated by red lines).
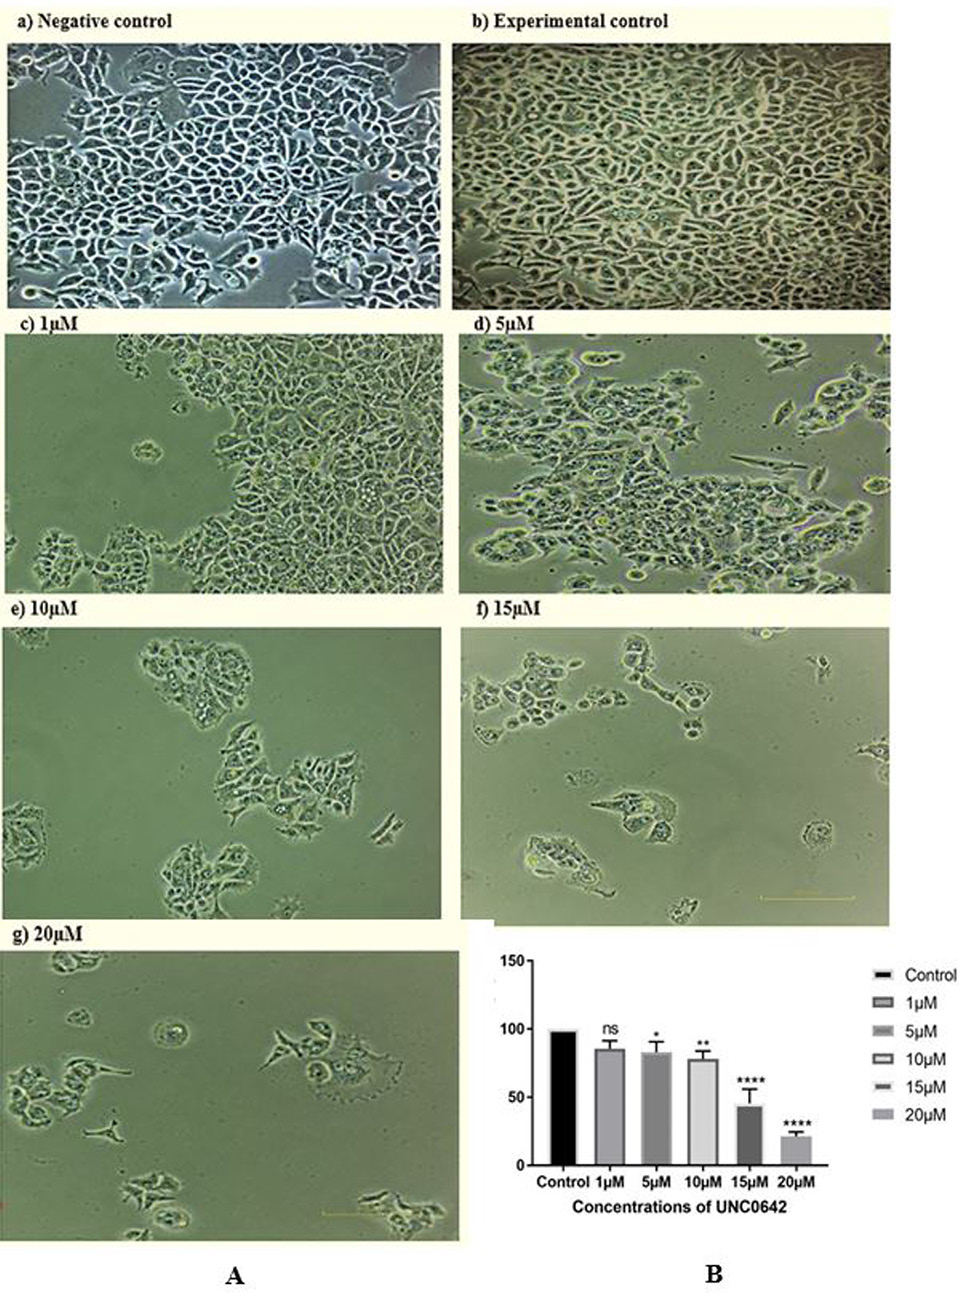
Effect of different concentrations of inhibitor UNC0642 administered for 48 h on the morphology of MCF-7 cells (A) (a) Negative control (untreated cells); (b) Experimental control (treated with 0.05% DMSO supplemented medium); (c) 1µM; (d) 5µM; (e) 10µM; (f) 15µM; (g) 20µM after 48 h treatment. The control cells showed normal morphology whereas UNC0642 treated cells exhibited stressed morphology with a significant decrease in the number of cells as the concentration of inhibitor is increased. (B) shows the effect of inhibitor on proliferation of MCF7 cells as determined by BrdU assay. The control cells were treated with 0.05% DMSO supplemented medium. See Figure 2 for statistical detail.
Effect of different concentrations of inhibitor UNC0642 administered for 48 h on relative expression of G9a (A), Cyclin D1 (B), fibroblast growth factor 1 (C) and Enolase 2 (D) genes determined by real-time PCR using HMBS as a reference gene for normalization and negative control (untreated) as calibrator. Compared with the respective controls, treatment with higher concentrations of inhibitor downregulated the expression of G9a, CCND1, FGF1 and ENO2 genes in both the cell lines. For statistical details see Figure 2.
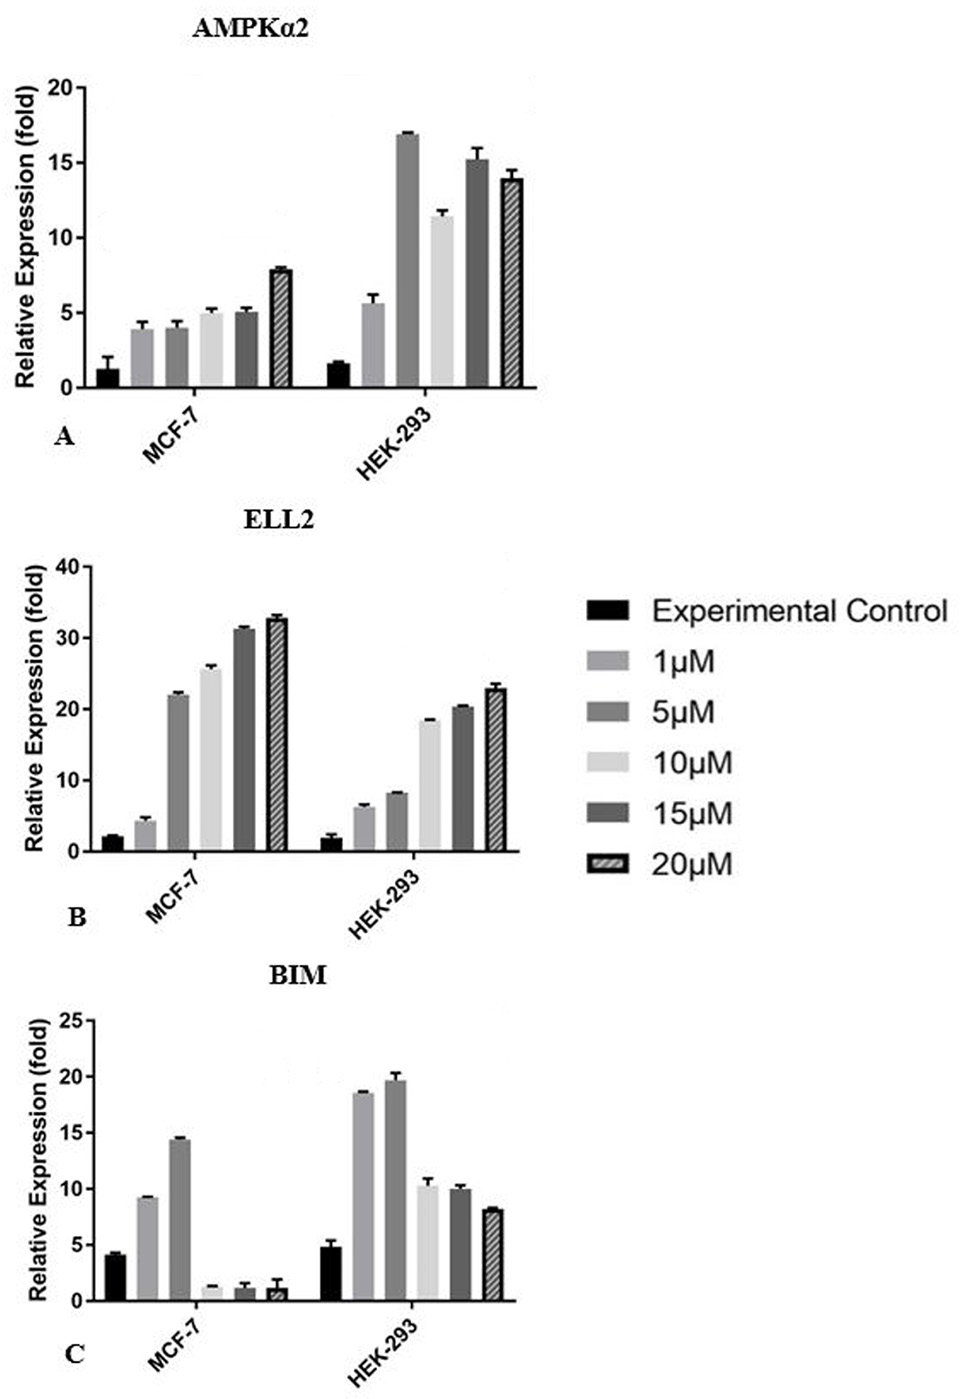
Effect of different concentrations of inhibitor UNC0642 administered for 48 h on relative expression of AMPKα2, ELL2 and Bcl-2 homology 3-only protein BIM genes determined by real-time PCR using HMBS as a reference gene for normalization and negative control (untreated) as calibrator. Compared with the respective controls, treatment with higher concentrations of UNC0642 upregulated the expression of AMPKα2 and ELL2 genes. Lower concentrations of inhibitor upregulated BIM expression in both cancerous and non-cancerous cell lines, whereas the higher concentrations downregulated the BIM gene expression in both cell lines. Statistical analysis was performed by using Two-way ANOVA with Tukey’s multiple comparison test.


