Effect of Acacia nilotica Against Nephrotoxicity Induced by Gentamicin in Rat: Role of Antioxidants, Anti-Inflammatory and Antiapoptotic Markers
Saed A. Althobaiti1, Safa H. Qahl2, Layaly Elsigar1, Lobna M.A. Gurafi1, Zeinab Kanani1, Mohamed Mohamed Soliman3* and Omaima Nasir1
1Department of Biology, Turabah University College, Taif University, P.O. Box 11099, Taif, Saudi Arabia.
2Department of Biology, College of Science, University of Jeddah, Saudi Arabia, P.O. Box. 80327, Jeddah 21589
3Clinical Laboratories Sciences Department, Turabah University College, Taif University, P.O. Box 11099, Taif, Saudi Arabia
* Corresponding author: mmsoliman@tu.edu.sa
Fig. 1.
Effect of Acacia nilotica (AN) supplementation on the level of Urea (A), creatinine (B) and serum Uric acid (C) of gentamicin treated rats. Values are represented as Mean ± SEM. The column mean values with different letters superscripts were significantly (a, b, c, d) (P < 0.05) different.
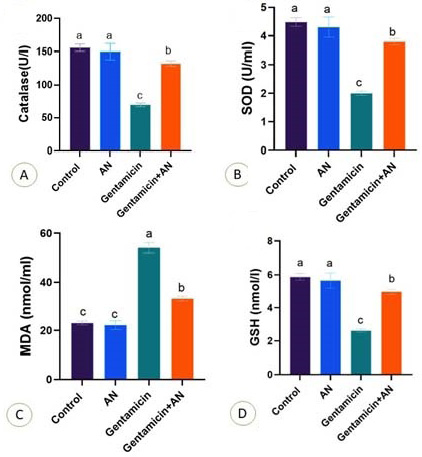
Fig. 2.
Effect of Acacia nilotica (AN) supplementation on the level of catalase (A), SOD (B), serum MDA (C) and GSH (D) of gentamicin treated rats. Values are represented as Mean ± SEM. The column mean values with different letters superscripts (a, b, c, d) were significantly (P < 0.05) different.
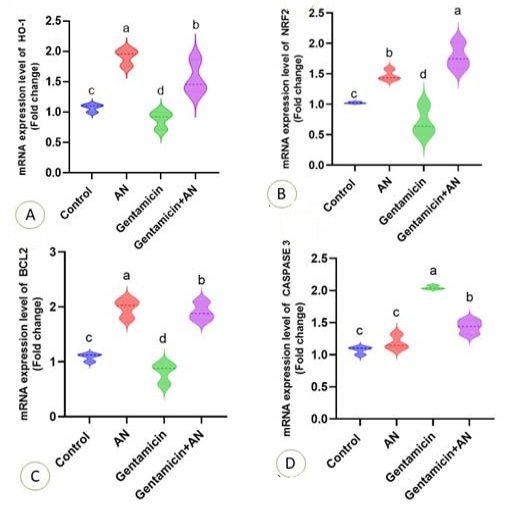
Fig. 3.
Effect of Acacia nilotica (AN) supplementation on the level mRNA expression of HO-1 (A), Nrf2 (B), BCl-2 (C) and Caspase-3 (D) of gentamicin treated rats. Values are represented as Mean ± SEM. The column mean values with different letters (a, b, c, d) superscripts were significantly P < 0.05 different.
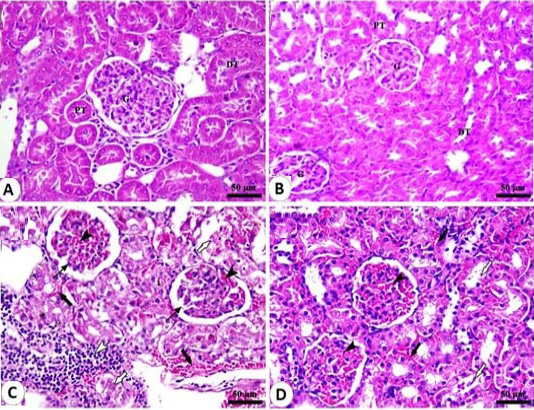
Fig. 4.
Histological structure of renal parenchyma of rats: A, control group showing intact renal corpuscles with glomeruli (G) surrounded with capsular space (G) in addition to normal proximal (PT) and distal convoluted tubules (DT). B, renal cortex of Acacia nilotia (AN) group showing normal renal corpuscles with glomeruli (G) surrounded with capsular space in addition to normal proximal (PT) and distal convoluted tubules (DT). C, renal cortex of gentamicin treated group showing shrinkage of glomeruli (thin black arrows) with severe congestion in glomeruli (black arrowheads) and interstitial blood vessels (thick black arrows) in addition to infiltration with inflammatory cells (white arrowheads) and tubular necrosis (white arrows arrows). D, renal cortex of gentamicin + AN treated group showing intact glomeruli with mild to moderate congestion in glomerular blood vessels (black arrowheads) and interstitial blood vessels (black arrows) in addition to sloughing of tubular epithelium and presence of cellular debris in the lumen of some tubules (white arrows).
Stain H and E, Bar= 50 µm.
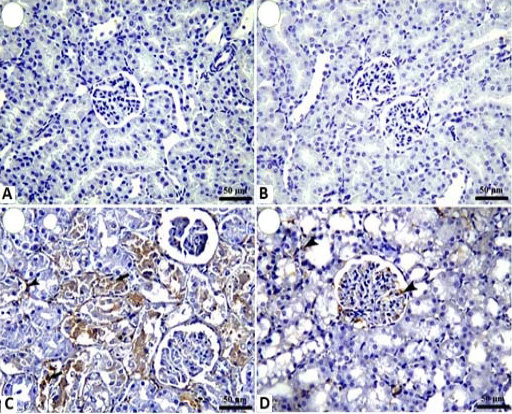
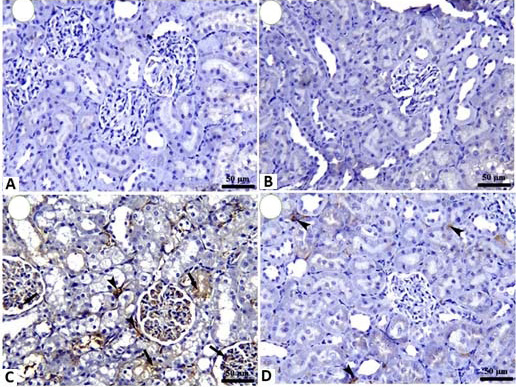
Fig. 6.
Histological structure of rat kidney: A, control group showing negative expression of NF-κB. B, AN treated group showing negative expression of NF-κB. C, gentamicin treated group showing a significant increase of NF-κB positive tubular epithelium (arrows) and interstitial cells (arrowhead). D, gentamicin+AN treated group showing marked negative expression of NF-κB in renal tubules with few positive interstitial cells and glomerular interstitial tissue (arrowheads).
NF-κB IHC, Bar= 50.
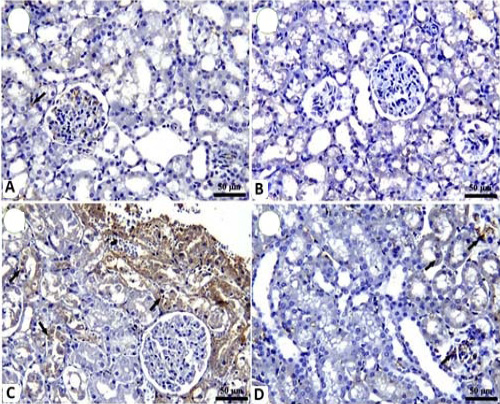
Fig. 7.
Histological structure of rat kidney: A, control group showing negative expression of TGF-β. B, AN treated group showing negative expression of TGF-β. C, gentamicin treated group showing a significant increase of TGF-β positive tubular epithelium and glomerular interstitial tissue (arrows) in addition to interstitial tissue ((arrowheads). D, gentamicin+AN treated group showing a marked decrease in TGF-β positive interstitial tissue of renal cortex (arrowheads).
TGF-β IHC, Bar= 50.
Fig. 5.
Histological structure of rat kidney: A, control group showing weak expression of COX-2 in renal tubules (arrow). B, AN treated group showing negative expression of COX-2. C, gentamicin treated group showing a significant increase of COX2 positive renal tubular epithelium (arrows). D, gentamicin + AN treated group showed a marked decrease in COX2-positive renal tubular epithelium (arrows).
COX-2 IHC, Bar= 50.


