

Feed Restriction Influences Growth Performance and Blood Glucose in Faster- and Slower- Growing Chickens


Feed Restriction Influences Growth Performance and Blood Glucose in Faster- and Slower- Growing Chickens
Ziyue Qin1, Zhen Wang1, Ali Mujtaba Shah3,4, Zifan Ning1, Yaofu Tian1, Qing Zhu1, Yan Wang1, Huadong Yin1, Zhichao Zhang1, Lu Zhang1, Lin Ye1, Diyan Li1, Gang Shu2 and Xiaoling Zhao1,*
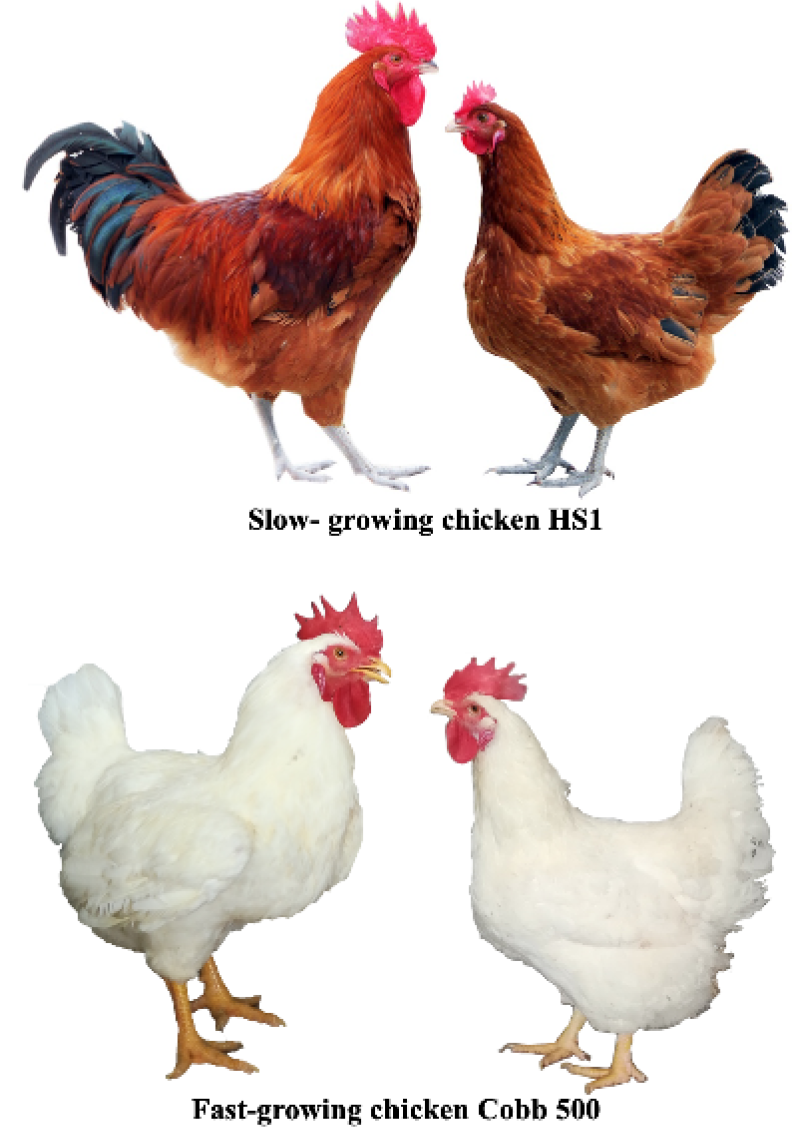
Fig. 1.
Images of chicken HS1 and Cobb 500.

Fig. 2.
Body weights (Mean ±SE) of two stocks with different levels of feed restriction from d 1 to 70. FG and SG represent faster- and slower-growing stocks, respectively. G1, G2, and G3 represent broilers fed with diet amount of 100%, 90%, and 80%, respectively. When significant, differences between FG and SG chickens are marked as * (p < 0.05).
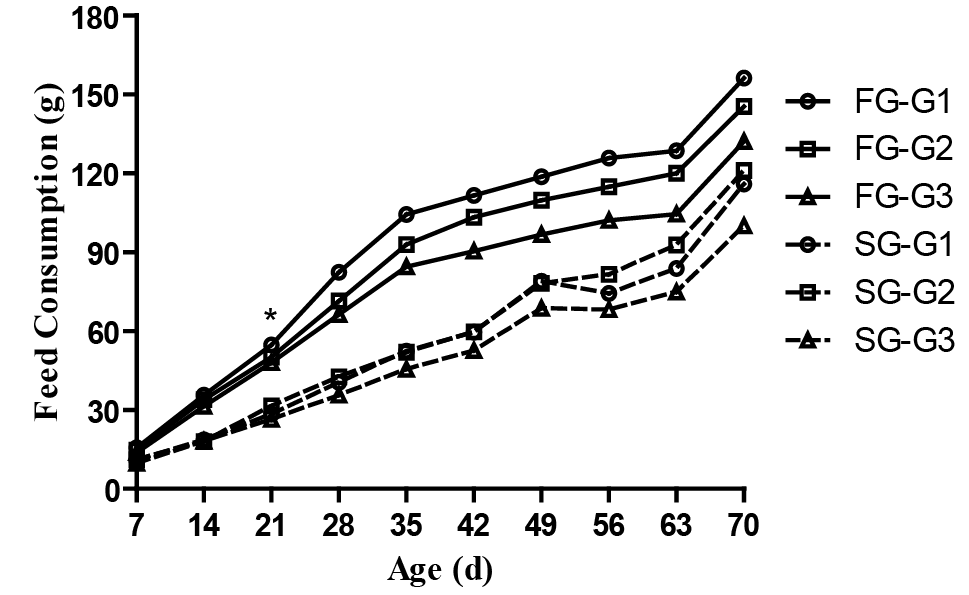
Fig. 3.
Feed consumption (Mean ±SE) of two stocks with different levels of feed restriction from d 7 to 70. For abbreviations and other statistical details, see Figure 2.
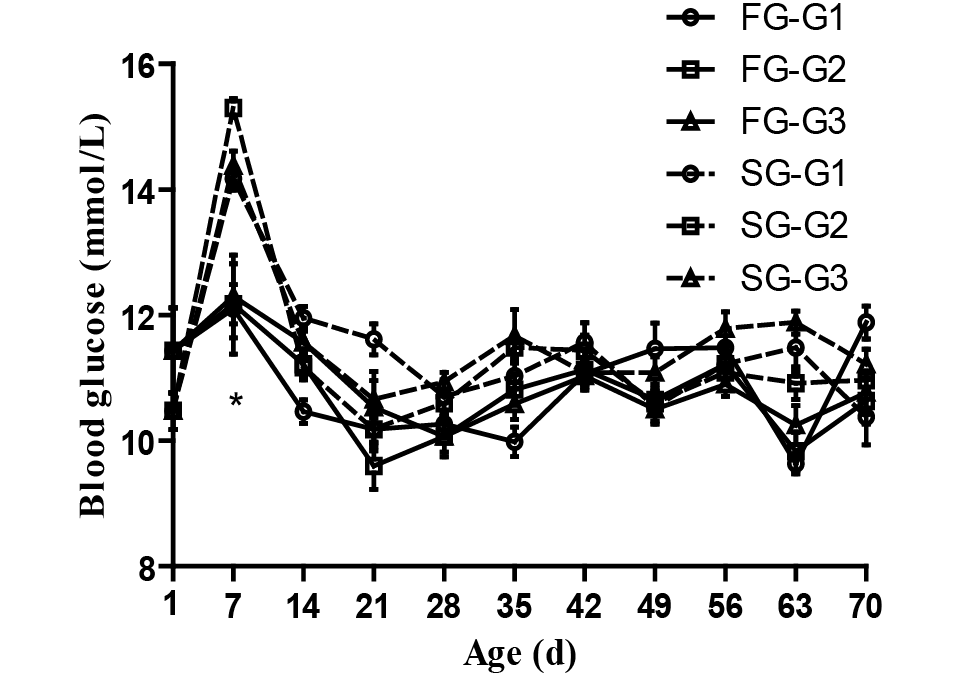
Fig. 4.
Blood glucose (BG) (Mean ±SE) of two stocks of chicken with different levels of feed restriction from d 1 to 70. For abbreviations and other statistical details, see Figure 2.
February 2022
Vol. 54, Iss. 1, Pages 1-501

