
Histopathological Alterations in Common Carp, Cyprinus Carpio L. Exposed to Titanium Dioxide Nanoparticles: A Concentration-Dependent Study


Histopathological Alterations in Common Carp, Cyprinus Carpio L. Exposed to Titanium Dioxide Nanoparticles: A Concentration-Dependent Study
Mustafa S. Arif1*, Sanaa. A. Mustafa1
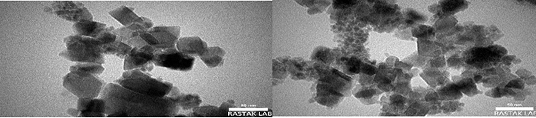
TEM image of TiO2NPs (Scale bars = 50nm).
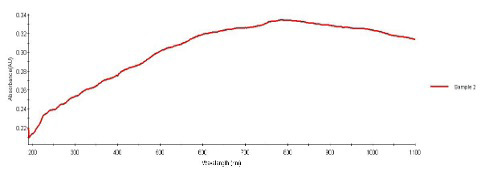
Ultraviolet visible spectra for samples of Tio2NPs.
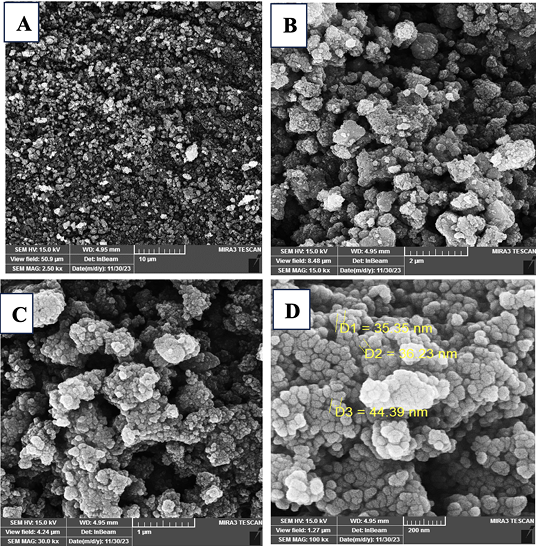
FESEM image showed a spherical to ovoid shape of synthesized TiO2NPs. Scale bar: A=10 μm, B=2 μm, C and D=1 μm.
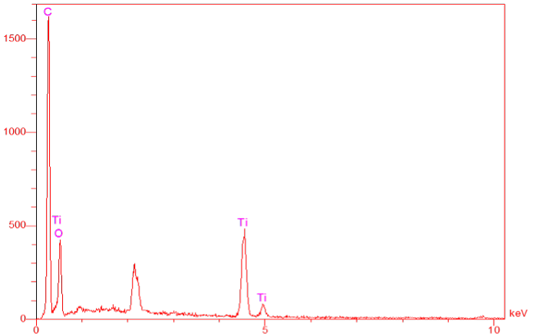
The EDX pattern of TiO2NPs.
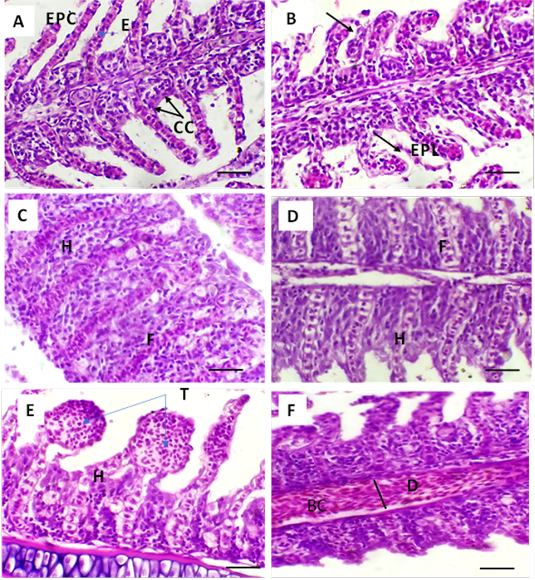
Photomicrograph of the gill tissue; A: control showing normal secondary lamellae (SL), epithelial cells (EPC), chloride cells (CC), erythrocyte (E); B: gill section of T1 showing epithelial lifting (EPL); C and D: gill sections of T2 and T3 showing hyperplasia (F) and fusion (F) of the secondary lamellae; E and F: gill section of T4 showing telangiectasis (T), dilation of the blood vessels (D) with blood congestion (BC) and hyperplasia of the secondary lamellae (H). Scale bars = 50 μm. Thickness = 5 μm.
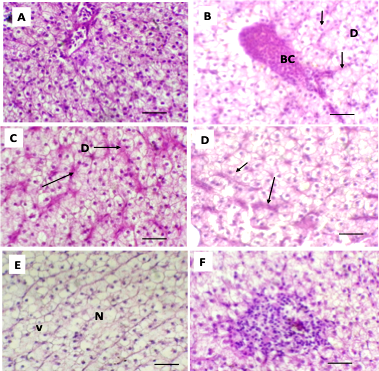
Photomicrograph of the liver tissue A: control showing normal structure of hepatocytes and sinusoids; B: liver section of T1 showing blood congestion of the portal vein with dilation of the sinusoids (D); C and D: liver section of T2 and T3 showing dilation of the sinusoids (D); with nuclear pyknosis (PK) E and F: T4 showing cytoplasmic vacuolation (V), necrosis in some of hepatocytes (V) and mononuclear cells infiltration (MNCs); Scale bars = 50 μm. Thickness = 5 μm.
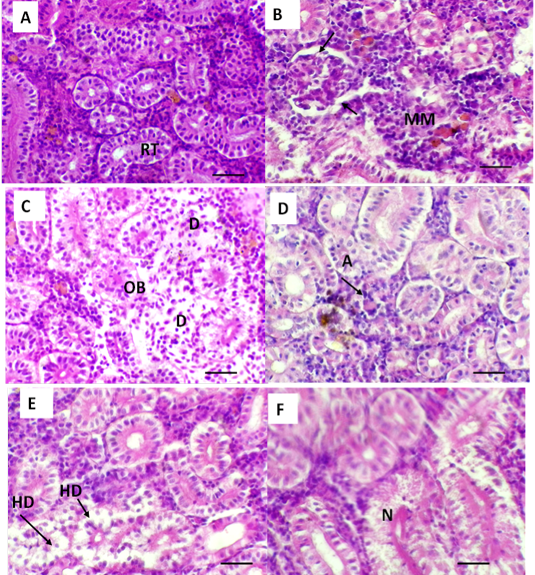
Photomicrograph of the kidney tissue; A: control showing normal renal tubules (RT) and hemopoietic tissue B: kidney section of T1 showing melanomacrophage aggregation (MM) with hemosiderosis; C : kidney section of T2 showing depletion of the hemopoietic tissue (D) with obstruction some of the renal tubules (OB); D: kidney section of T3 displaying atypical character of the glomerulus (A);; E and F: T4 demonstrating hydropic degeneration (HD) and necrosis in renal tubules (N);Scale bars = 50 μm. Thickness = 5 μm.

