

Identification of Therapeutic Targets and Prognostic Biomarkers Among Matrix Metalloproteinases in the Ovarian Cancer Microenvironment


Identification of Therapeutic Targets and Prognostic Biomarkers Among Matrix Metalloproteinases in the Ovarian Cancer Microenvironment
Mao MeiYa, Sheng Yuehua, Ding Huiqing*, Zheng Xiaojiao and Du Yongming
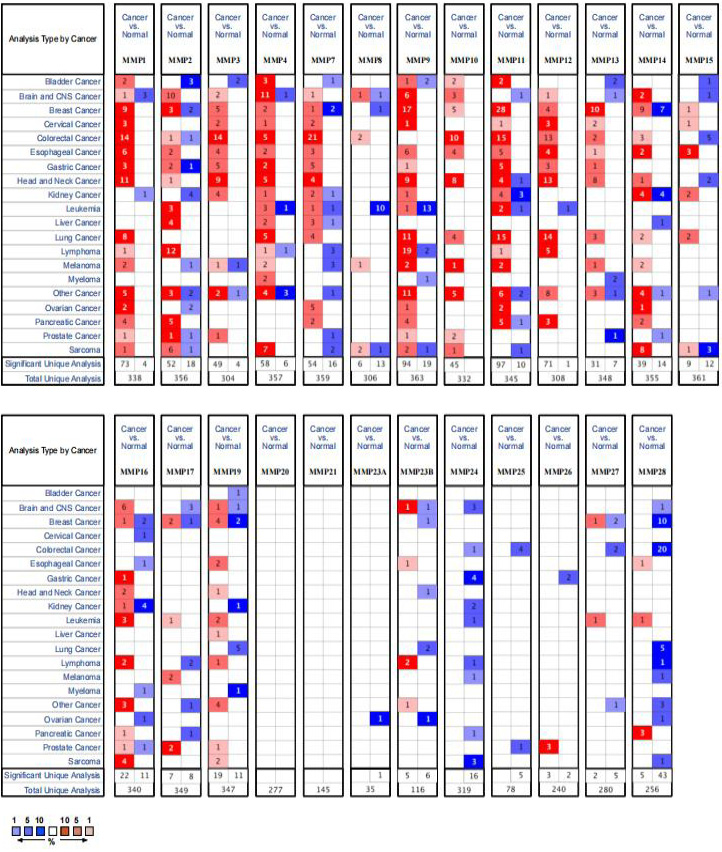
Expression of MMPs in cancer vs. normal tissues from the oncomine database. The figure shows the numbers of datasets with statistically significant mRNA over-expression (red) or downregulated expression (blue) of MMP protein family.
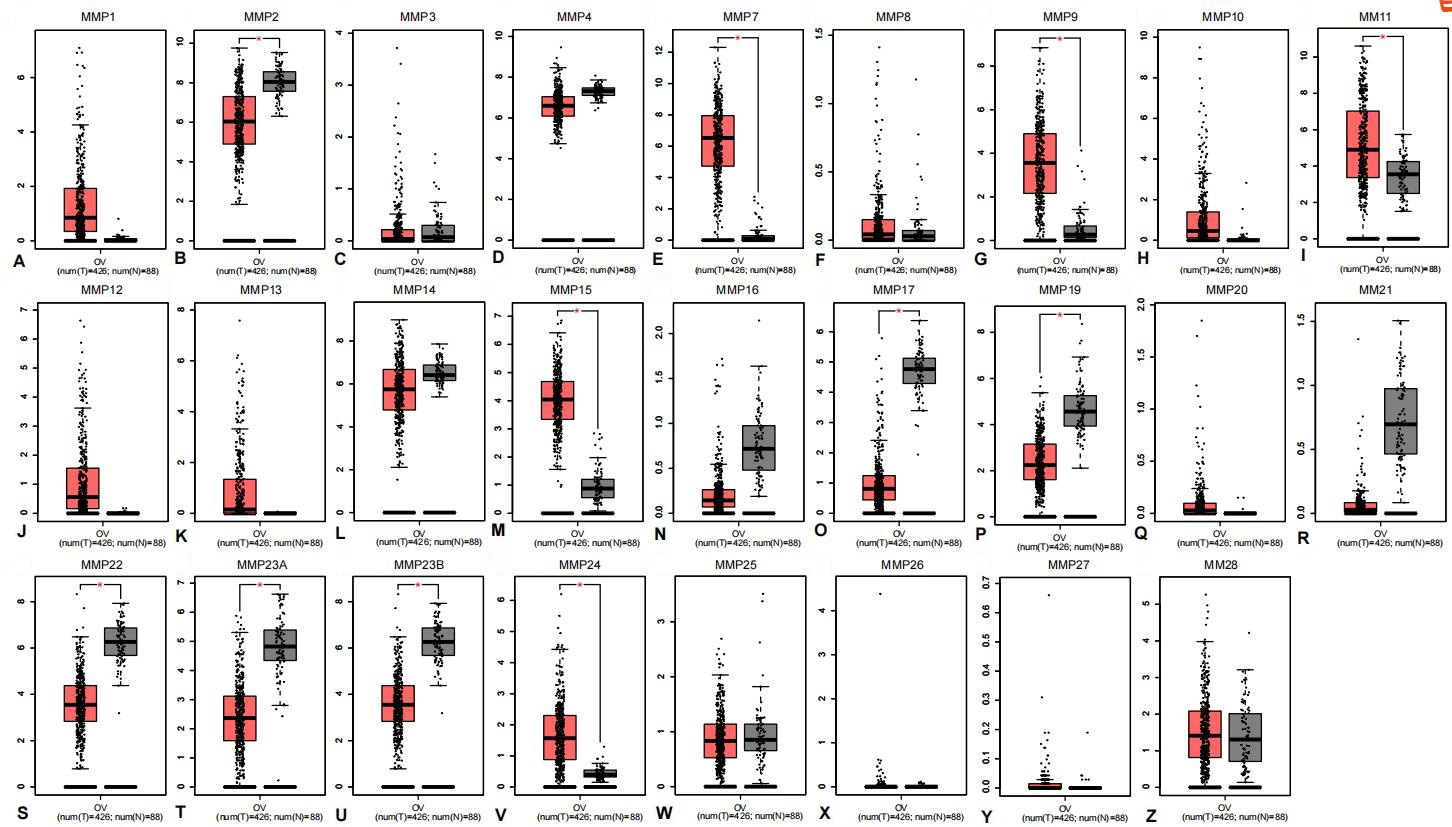
Expression of MMPs in ovarian cancer and normal tissues analyzed using GEPIA. (A) MMP1, (B) MMP2, (C)MMP3, (D) MMP4, (E) MMP7, (F) MMP8, (G) MMP9, (H) MMP10, (I) MMP11, (J) MMP12, (K) MMP13, (L) MMP14 (M) MMP15, (N) MMP16, (O) MMP17, (P) MMP19, (Q) MMP20, (R) MMP21, (S) MMP22, (T) MMP23A, (U) MMP23B, (V) MMP24, (W) MMP25, (X) MMP26, (Y) MMP27 and (Z) MMP28. In the box plots, the thick line in the middle represents the median, and the upper and lower limits of the box represent the third and first quartile, respectively. The top and bottom of the error bars represent the maximum and minimum values of data, respectively; outliers were considered to Log2FC Cutoff: 1, p-value: 0.01.
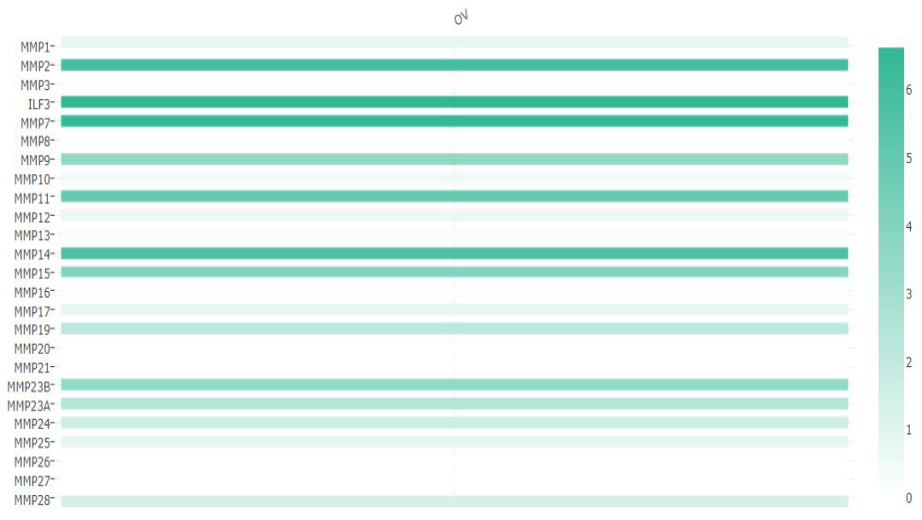
The relative level of MMPs in OC.
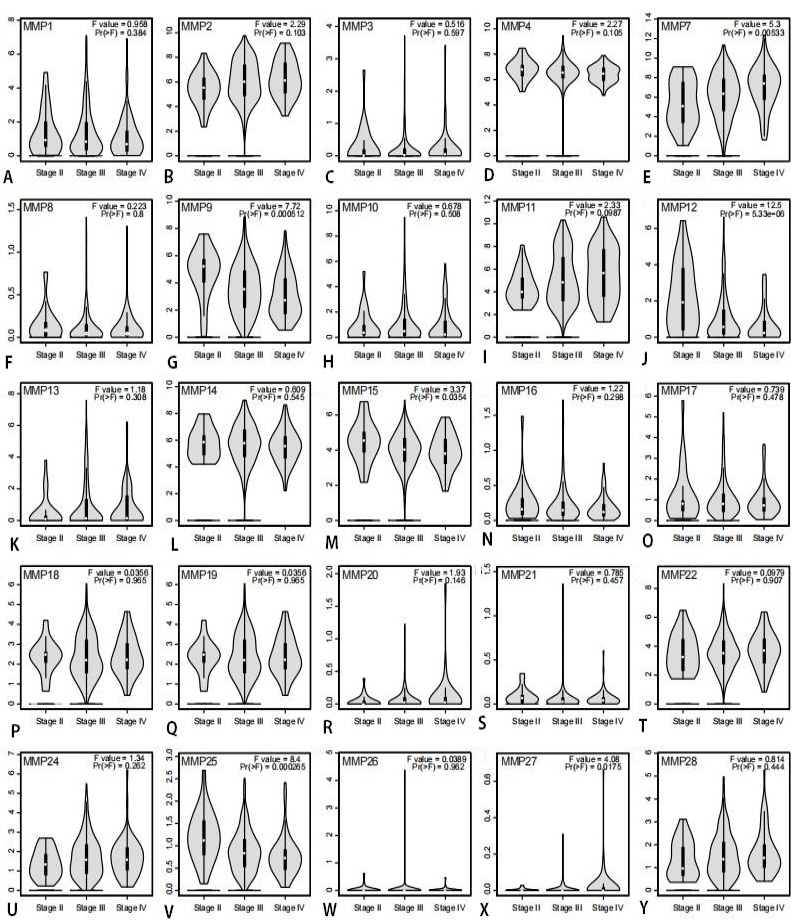
Association of mRNA expression of MMPs and tumor stages in patients with ovarian cancer analyzed using GEPIA. (A-D) MMP1-4, (E-T) MMP7-22 and (U-Y) MMP24-28. In the violin plots, the white dots represent the median; the black bars represent the 95% confidence intervals; the black lines represent the interquartile range; and the width of the red shapes represent the density of distribution. F-value, the statistical value of F test; Pr (>F), P-value.
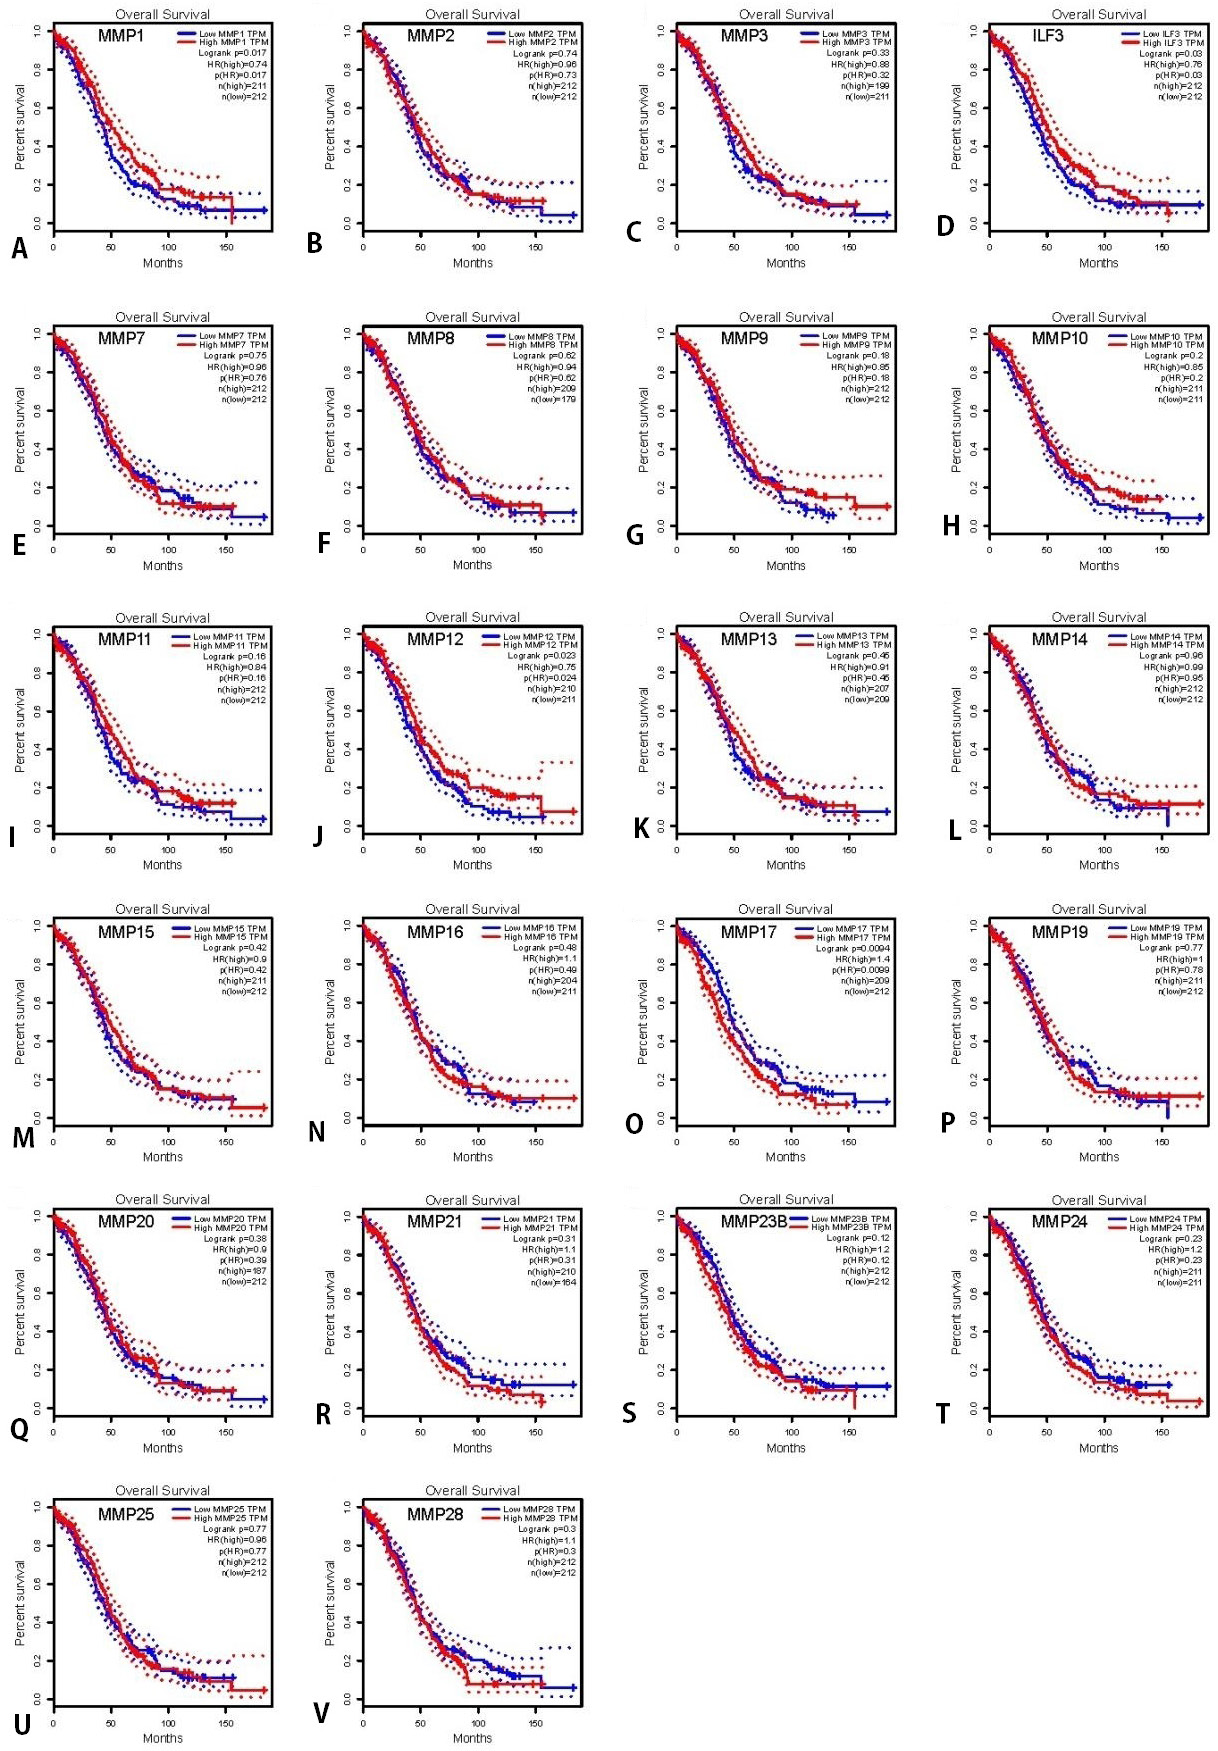
OS of OC patients with high and low mRNA expression of MMP, analyzed using the Kaplan-Meier Plotter tool. (A‑V)OS curves of MMP1-28 plotted for all patients . The threshold of p-value of < 0.05.
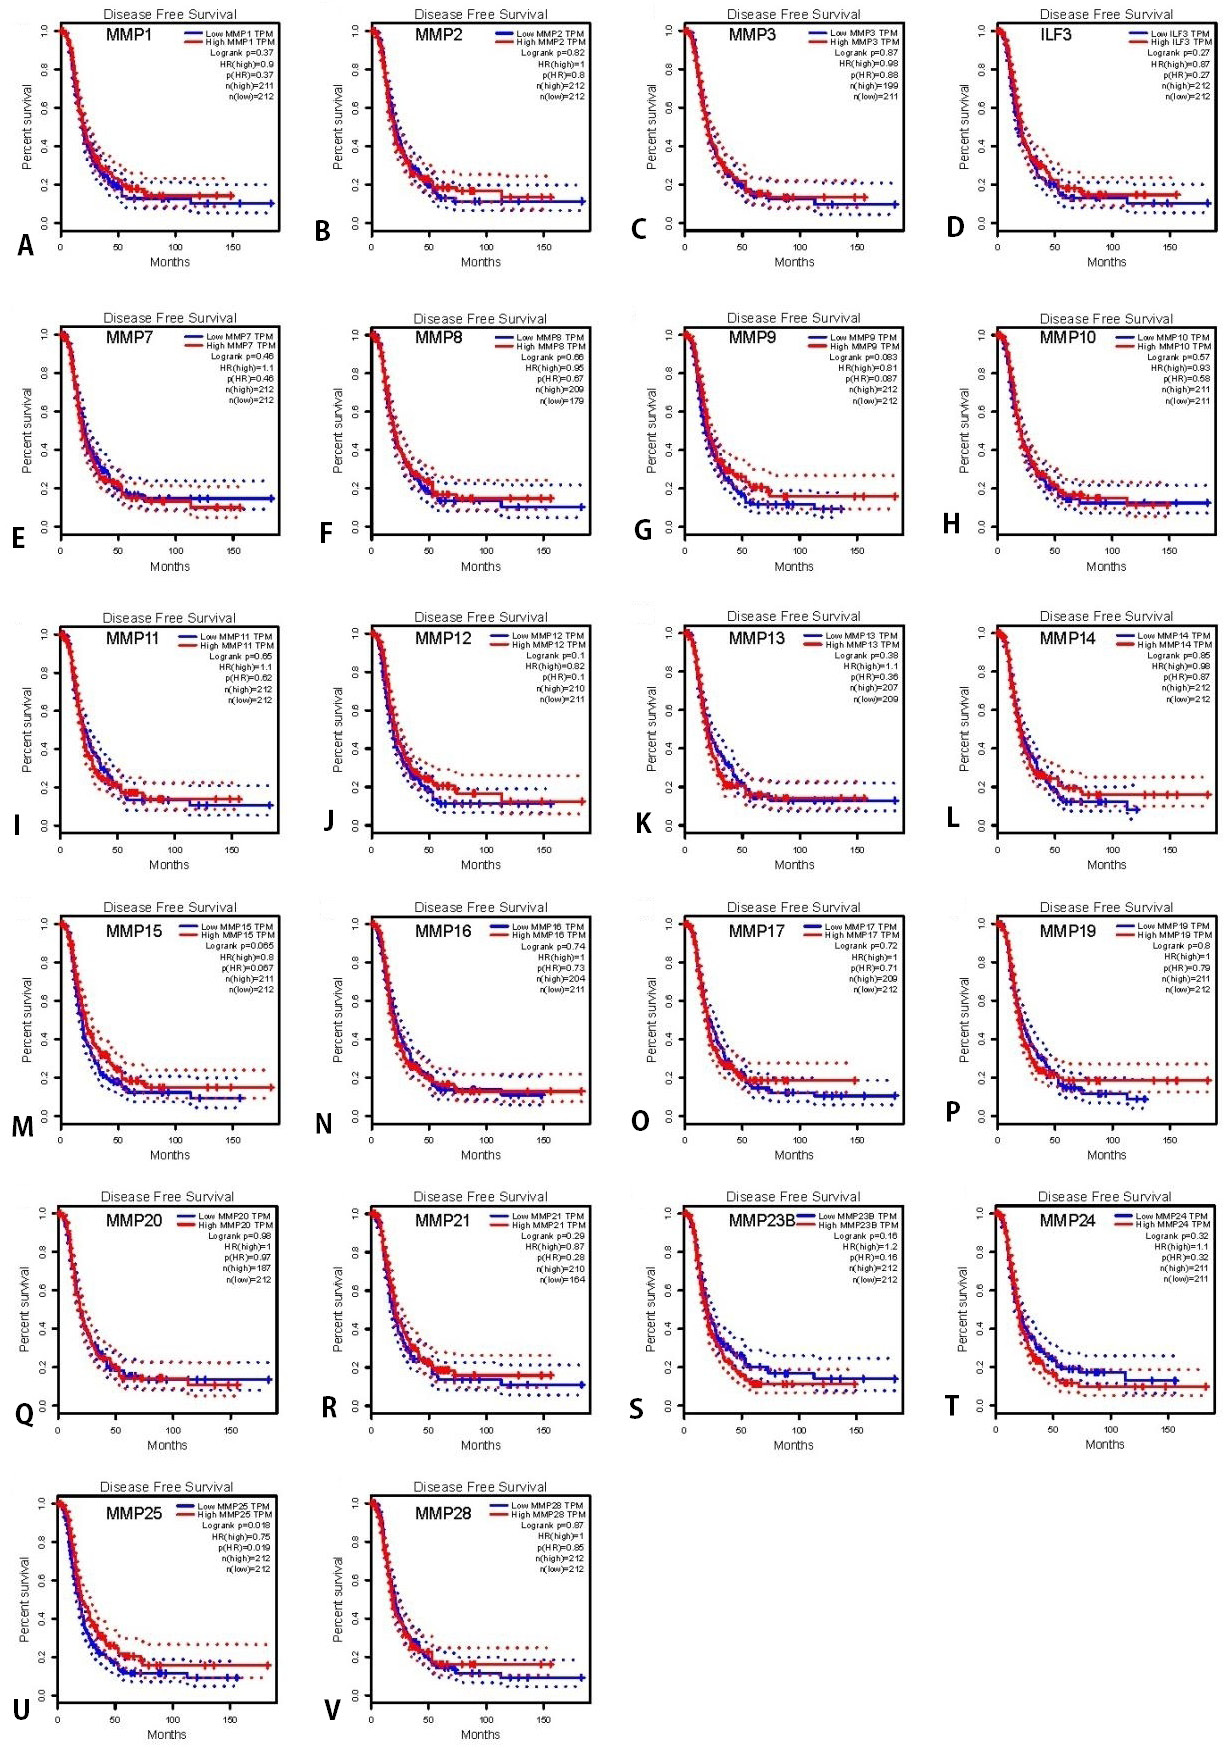
DFS of OC patients with high and low mRNA expression of MMP, analyzed using the Kaplan-Meier Plotter tool. (A‑V) PFS curves of MMP1-28 plotted for all patients. The threshold of p-value of < 0.05.
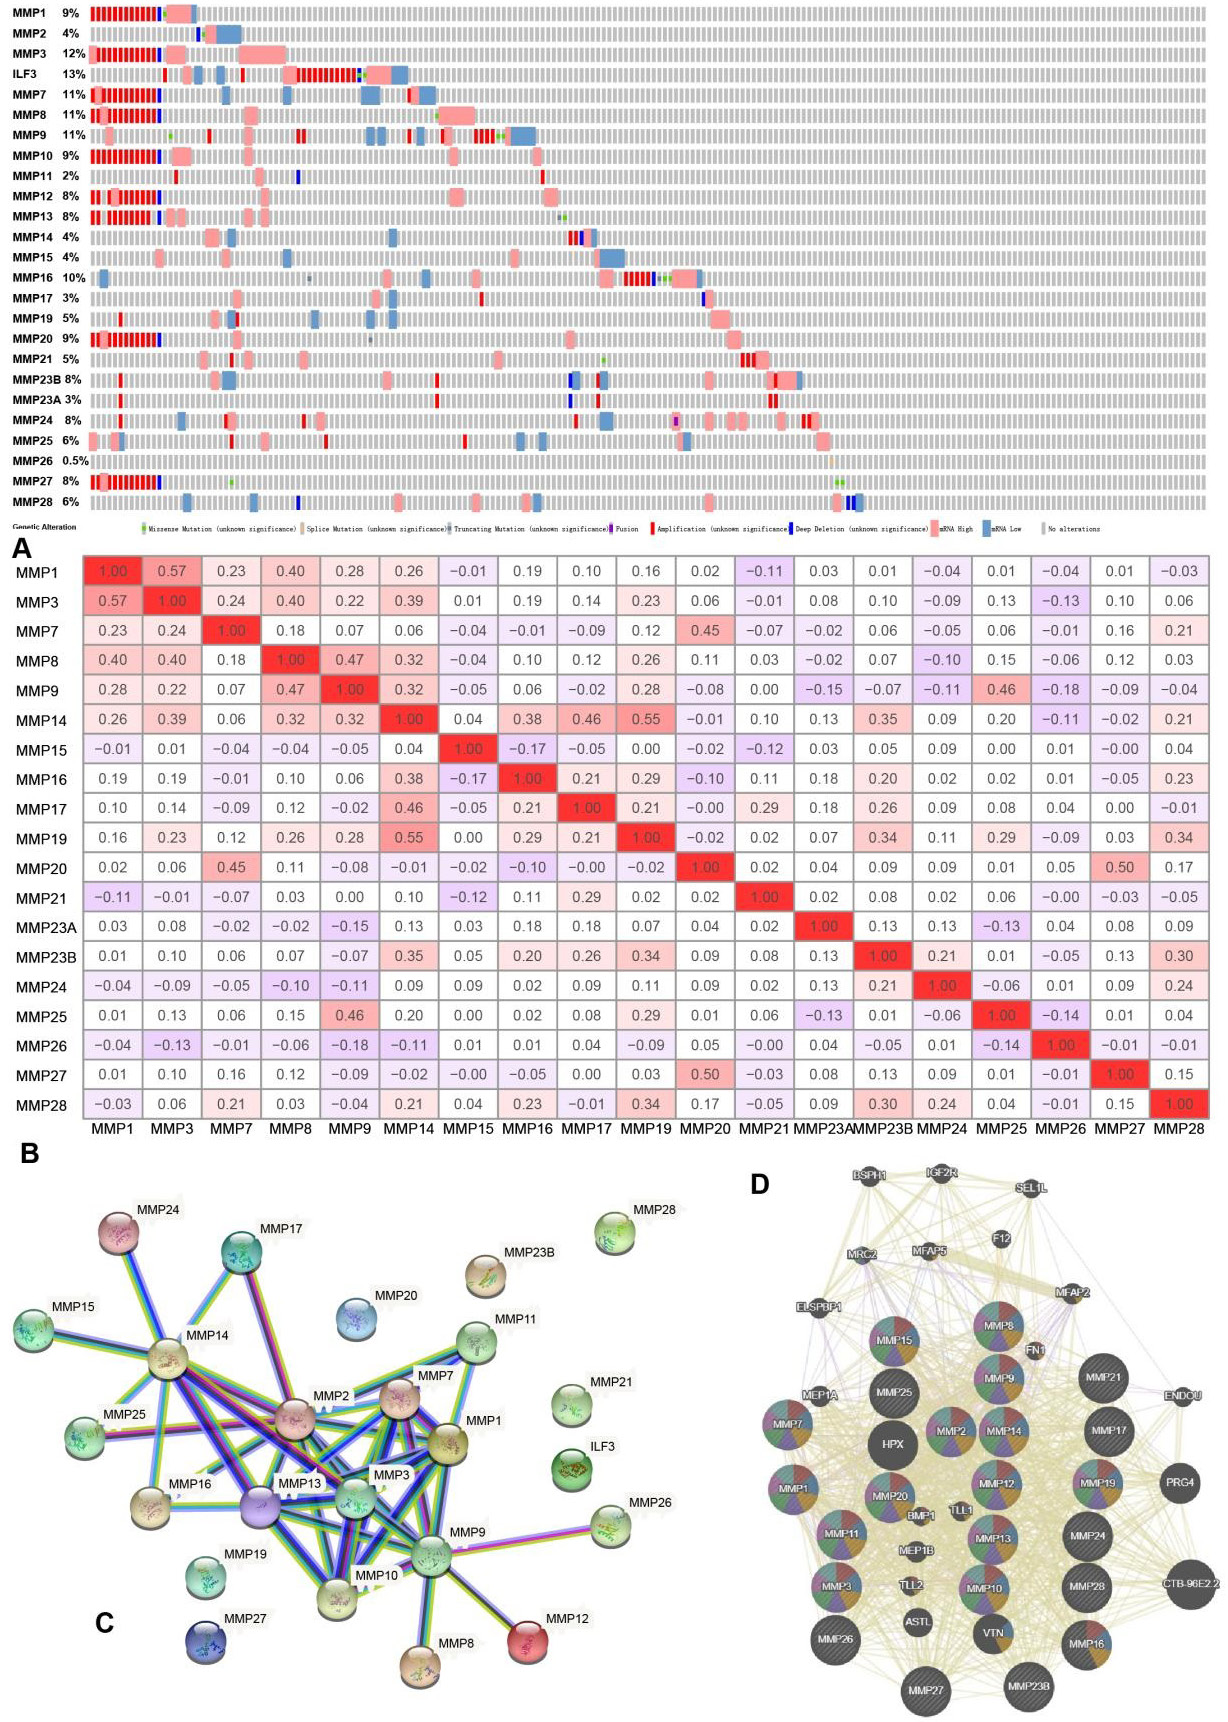
The genetic alteration, co-expression, and PPI network analyses of MMPs. (A) Genetic alterations in MMPs in OC using cBioPortal. (B) Correlation heat map of MMPs in OC using TCGA database. (C) PPI network of MMPs using STRING. (D) Physical interaction network of MMPs using GeneMANIA.
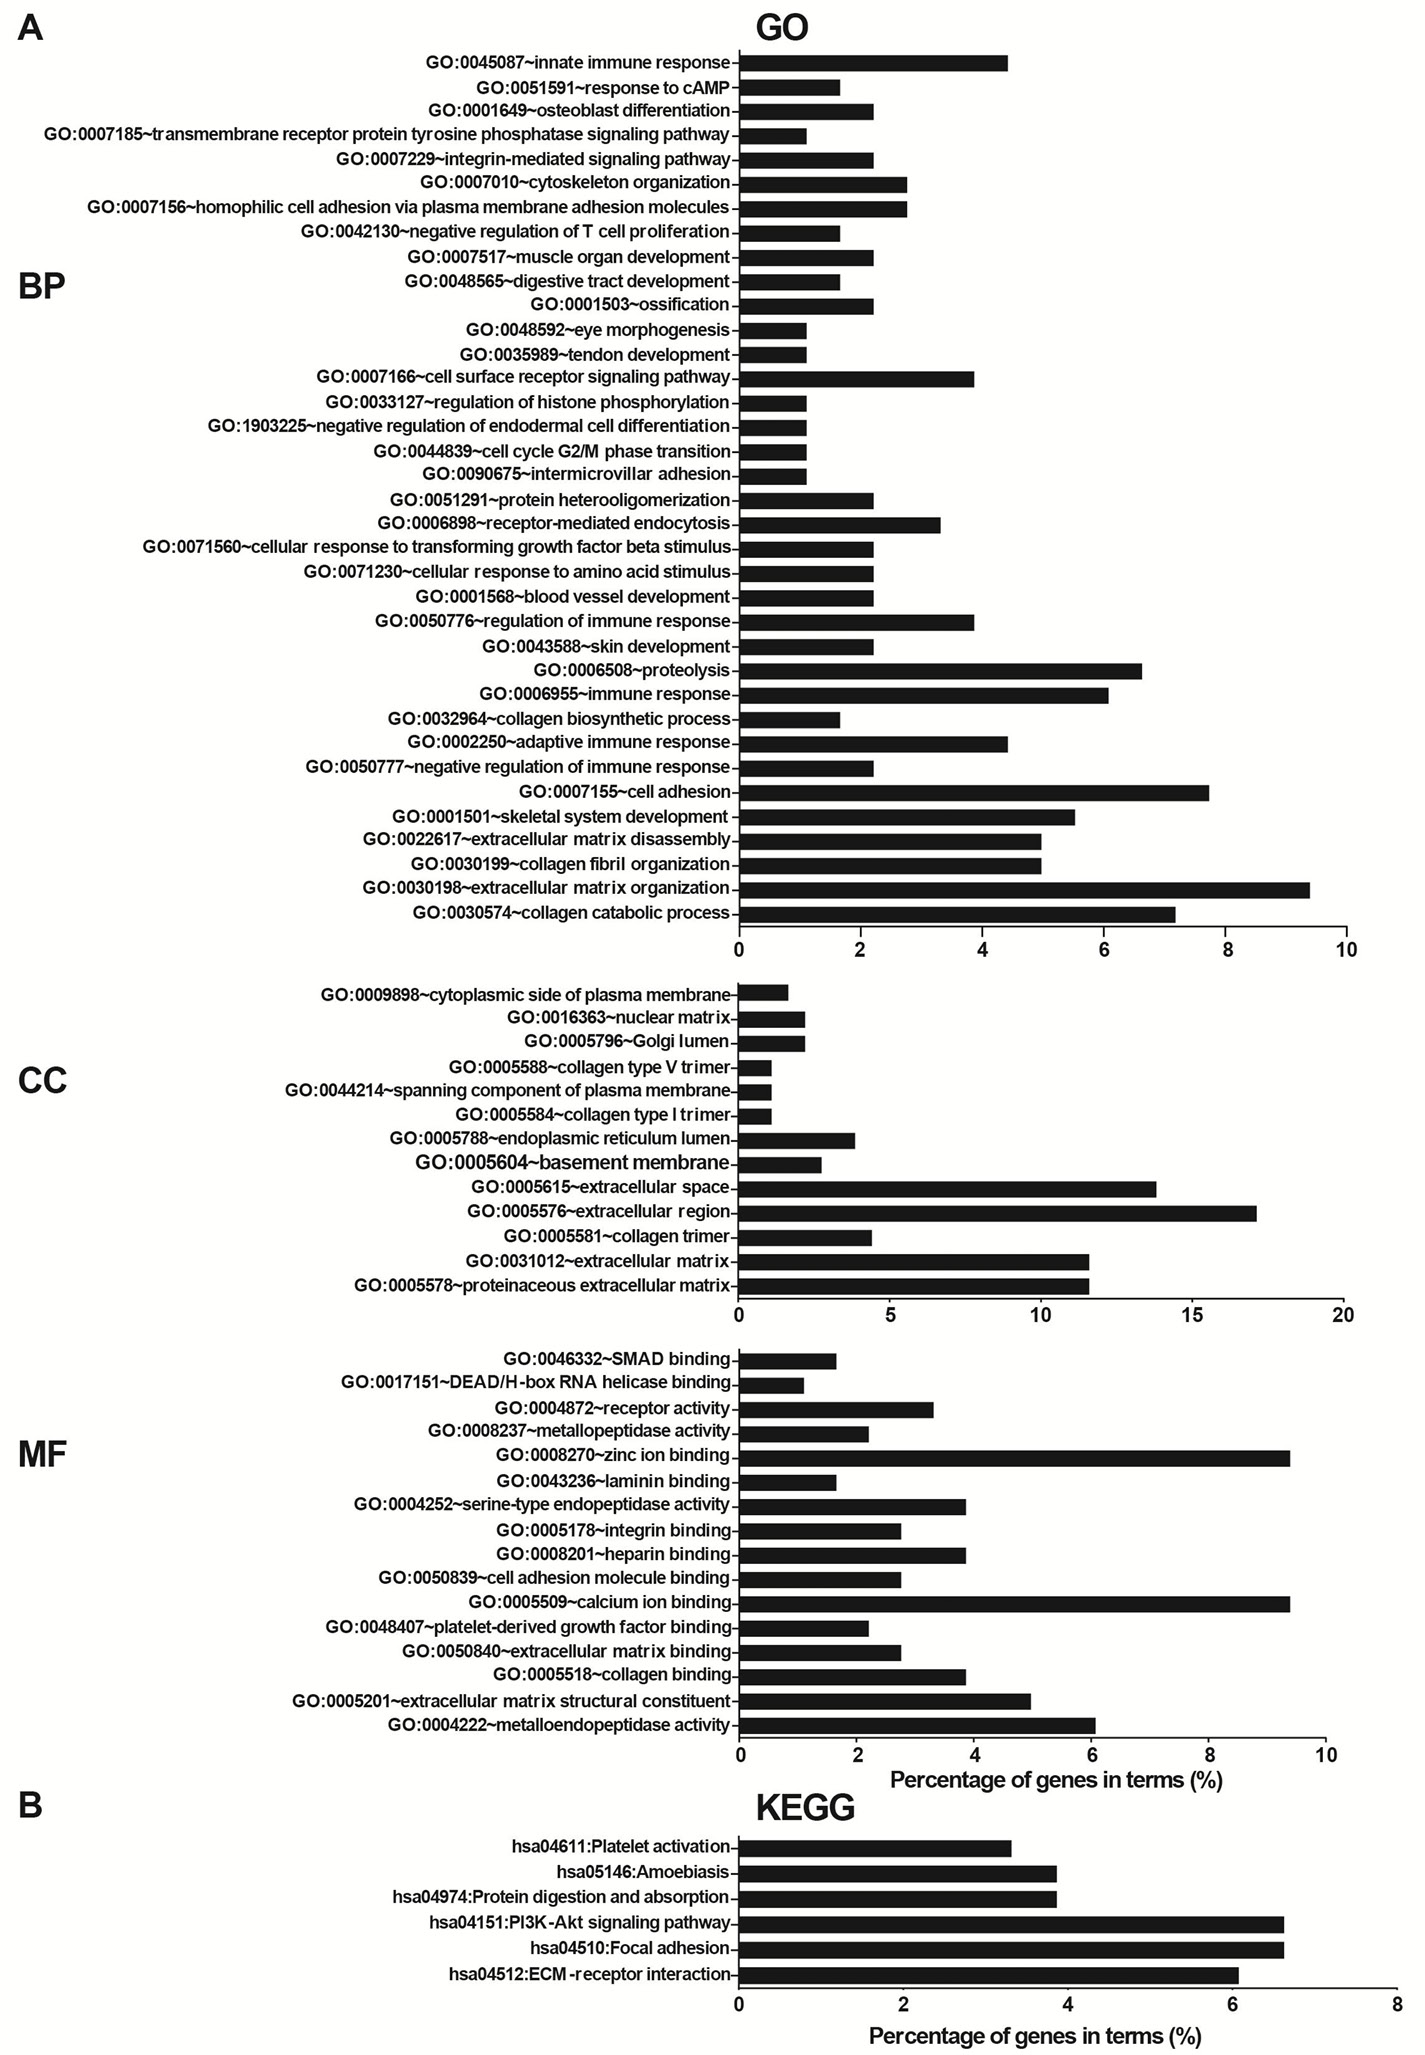
Functional enrichment analysis of MMPs in OC (DAVID 6.8), (A) gene ontology (GO) and (B) Kyoto Encyclopedia of Genes and Genomes (KEGG) enrichment analysis results.
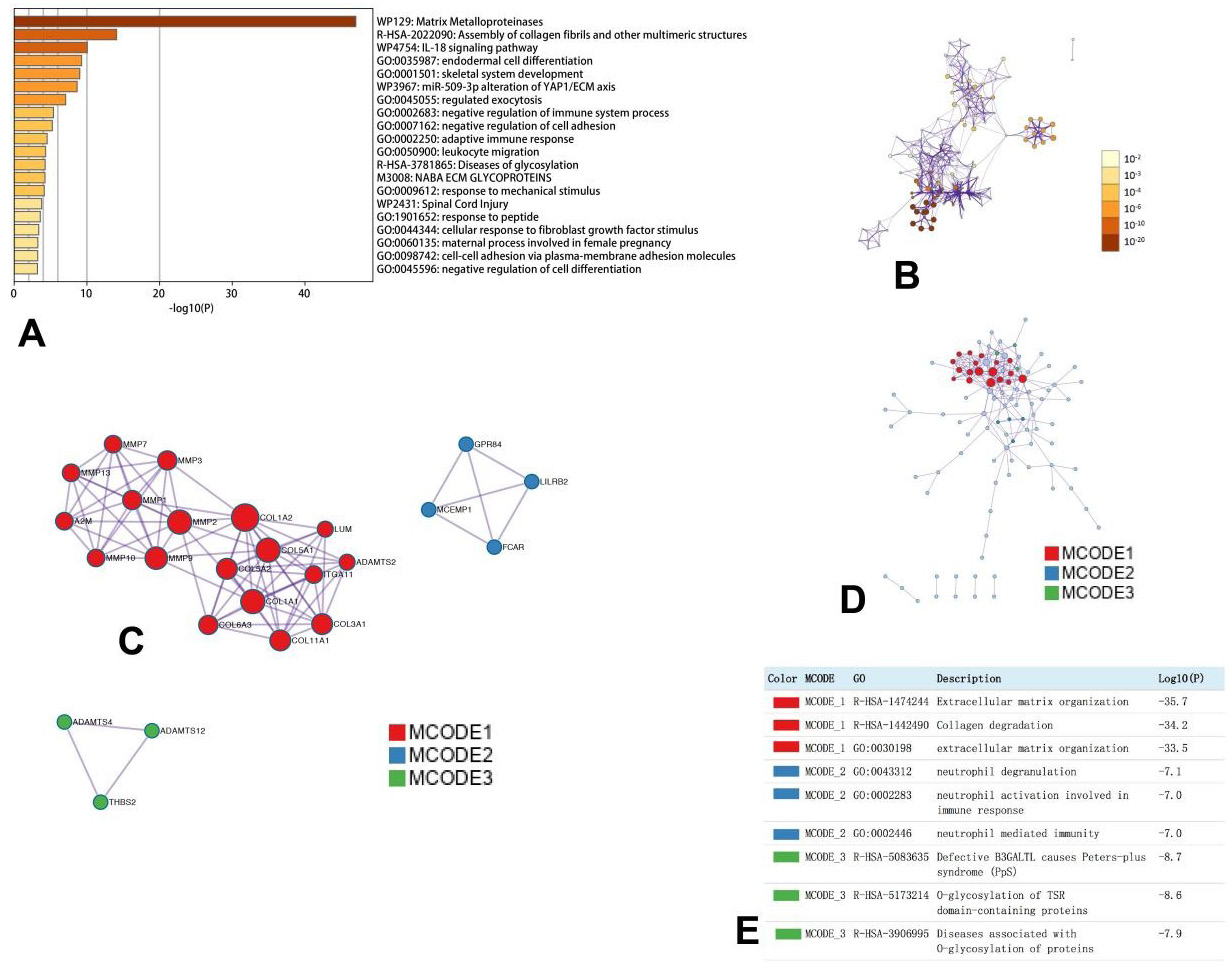
The enrichment analysis of MMPs and neighboring genes in OC (Metascape). (A) Heatmap of Gene Ontology (GO) enriched analysis (B) Interaction Network of GO enriched analysis, colored by cluster ID, color by p-value. (C, D). Protein, protein interaction network and MCODE, components identified in different expressed MMPs.
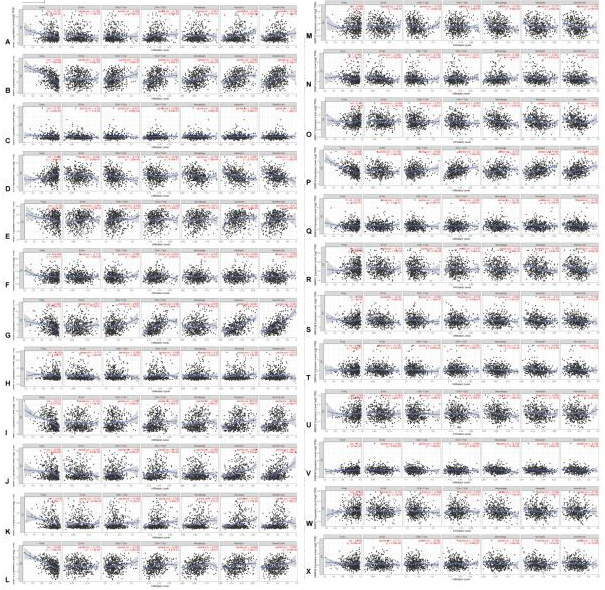
The correlation between MMPs and immune cell infiltration in OC. A comprehensive analysis of the correlation between MMPs and six immune cell infiltrations (B cells, CD4+ T cells, CD8+ T cells, neutrophils, macrophages, and dendritic cells) was performed using TIMER web server.
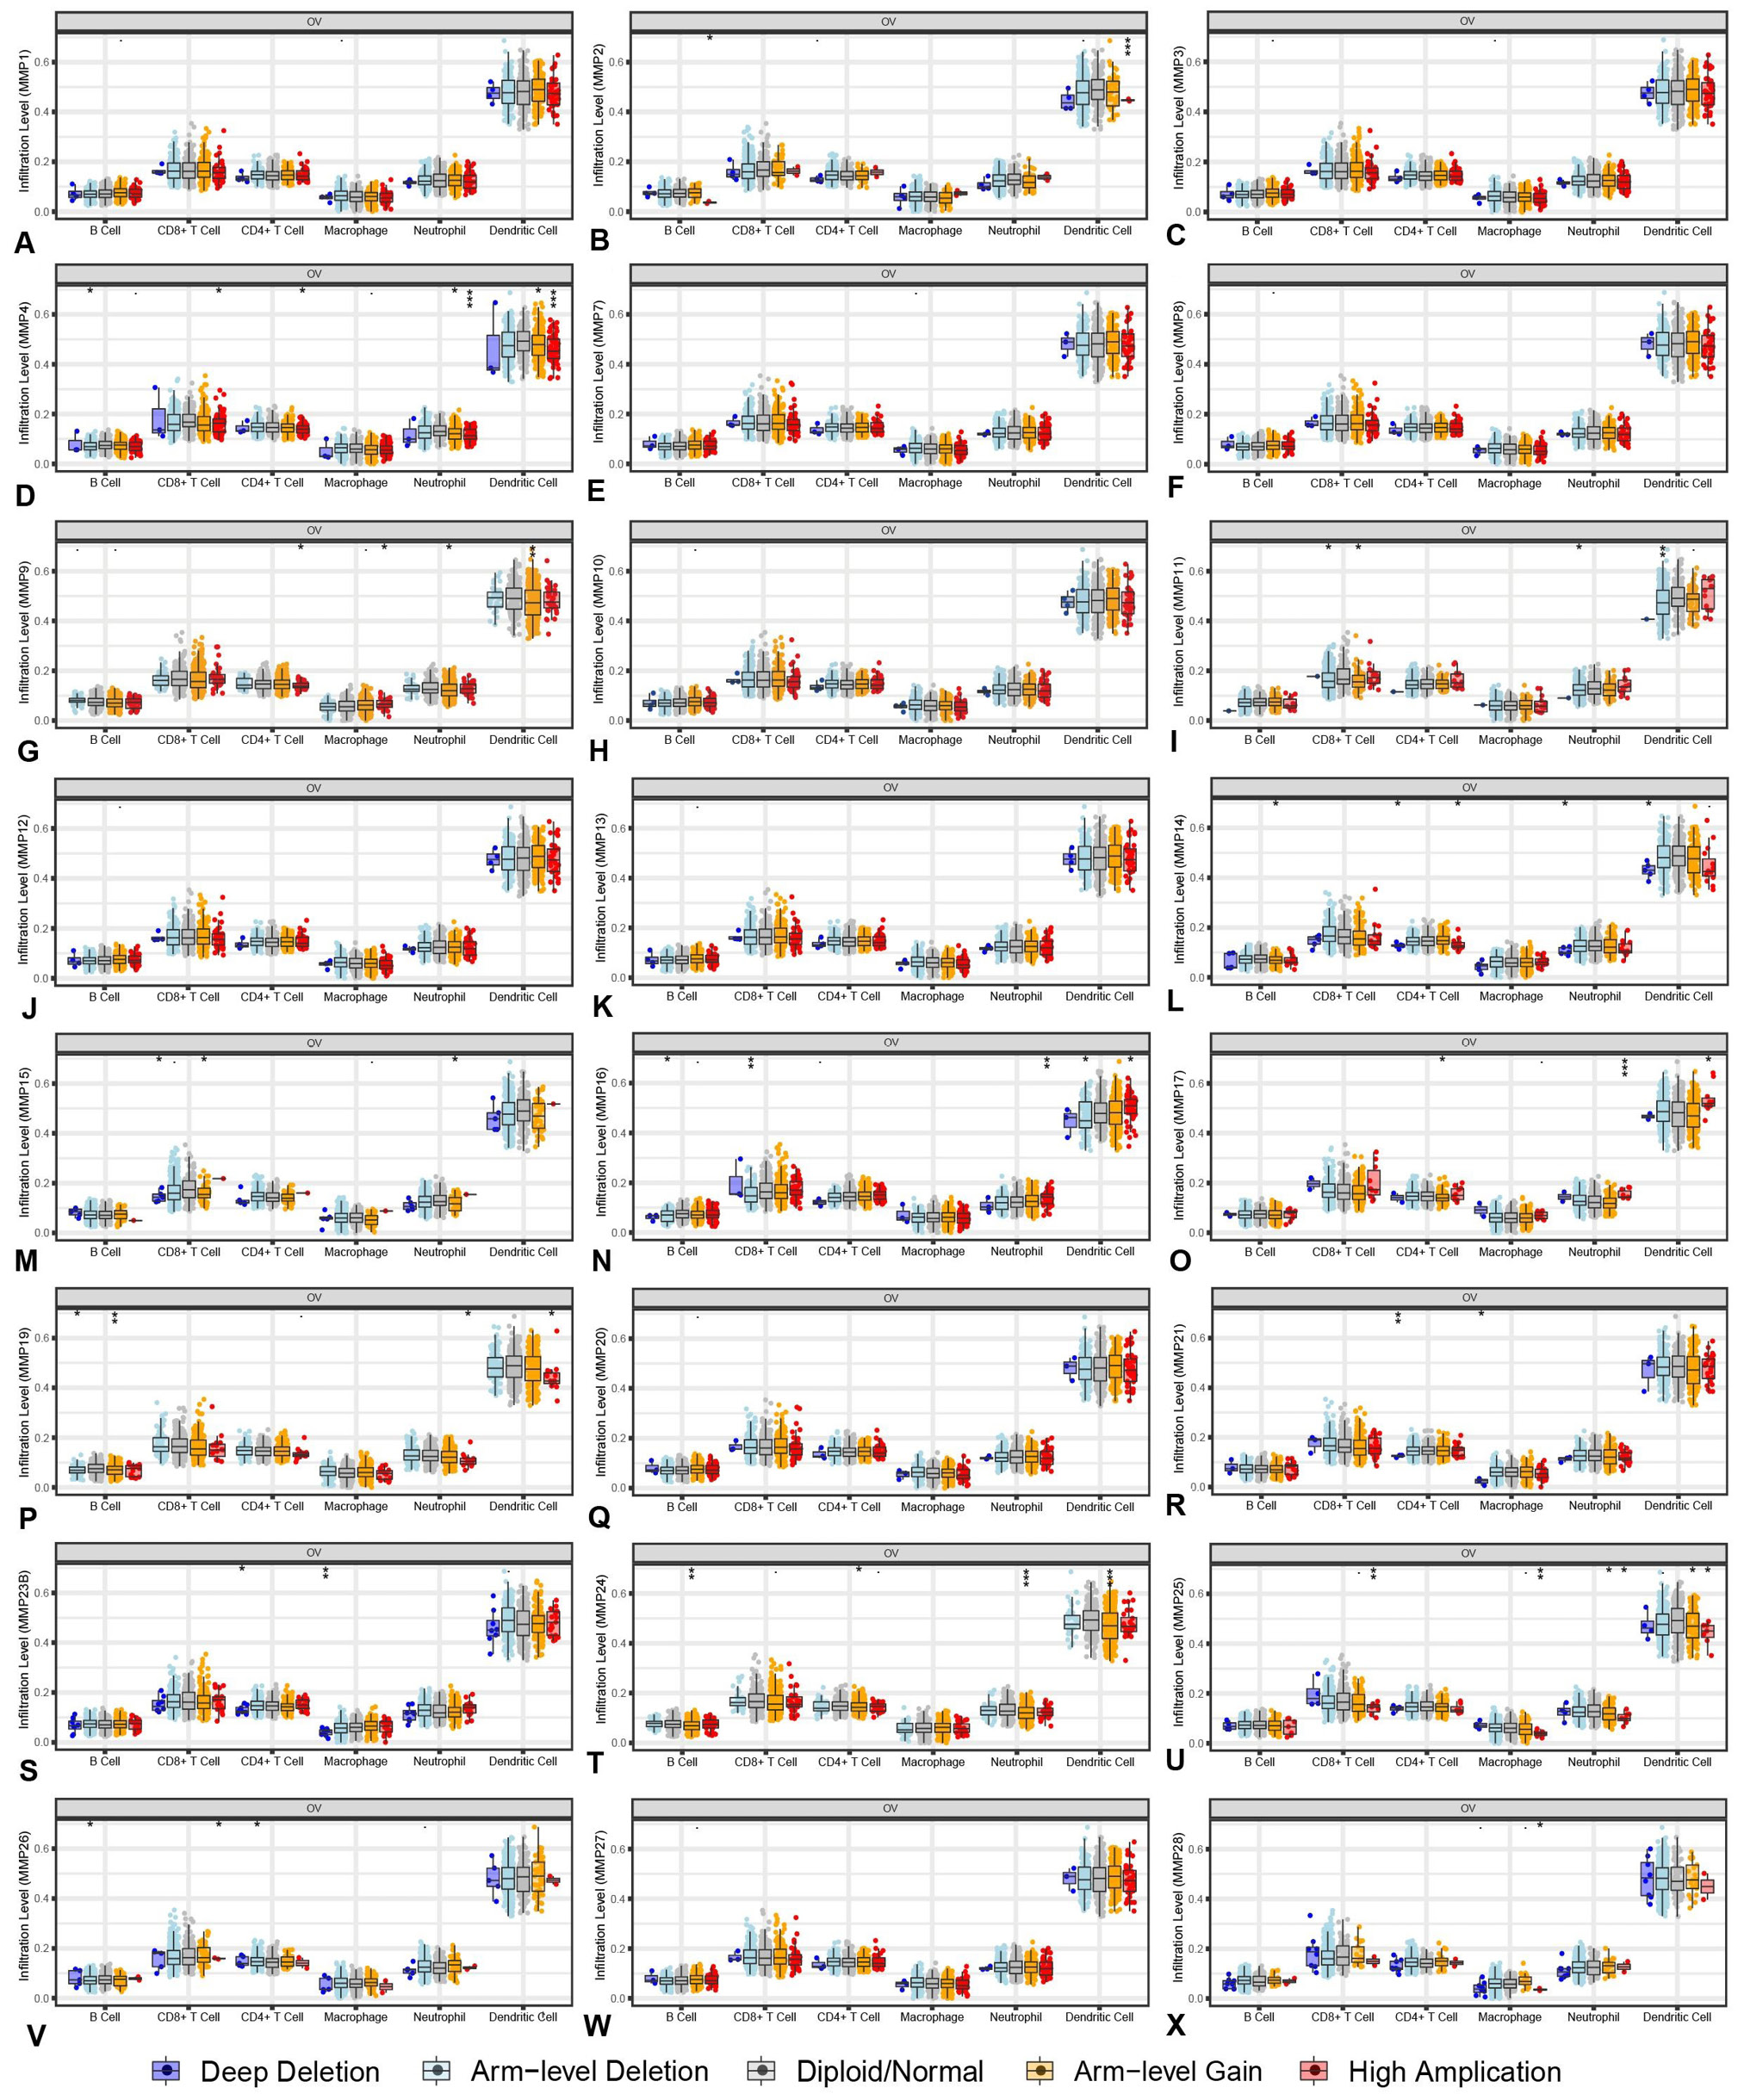
The infiltration of immune cells caused by gene copy number alteration of differentially expressed MCMs (TIMER). *P<0.05, **P<0.01 and ***P<0.001.

