Influences of Predator Cues on the Incidence of Ungulates, Mesopredators and Top Predators in the Greater Khingan Mountains, Northeastern China
Influences of Predator Cues on the Incidence of Ungulates, Mesopredators and Top Predators in the Greater Khingan Mountains, Northeastern China
Hamenya Mpemba1, Fan Yang1, Kirsty J. MacLeod2,3, Dusu Wen1, Yan Liu1,4 and Guangshun Jiang1,*
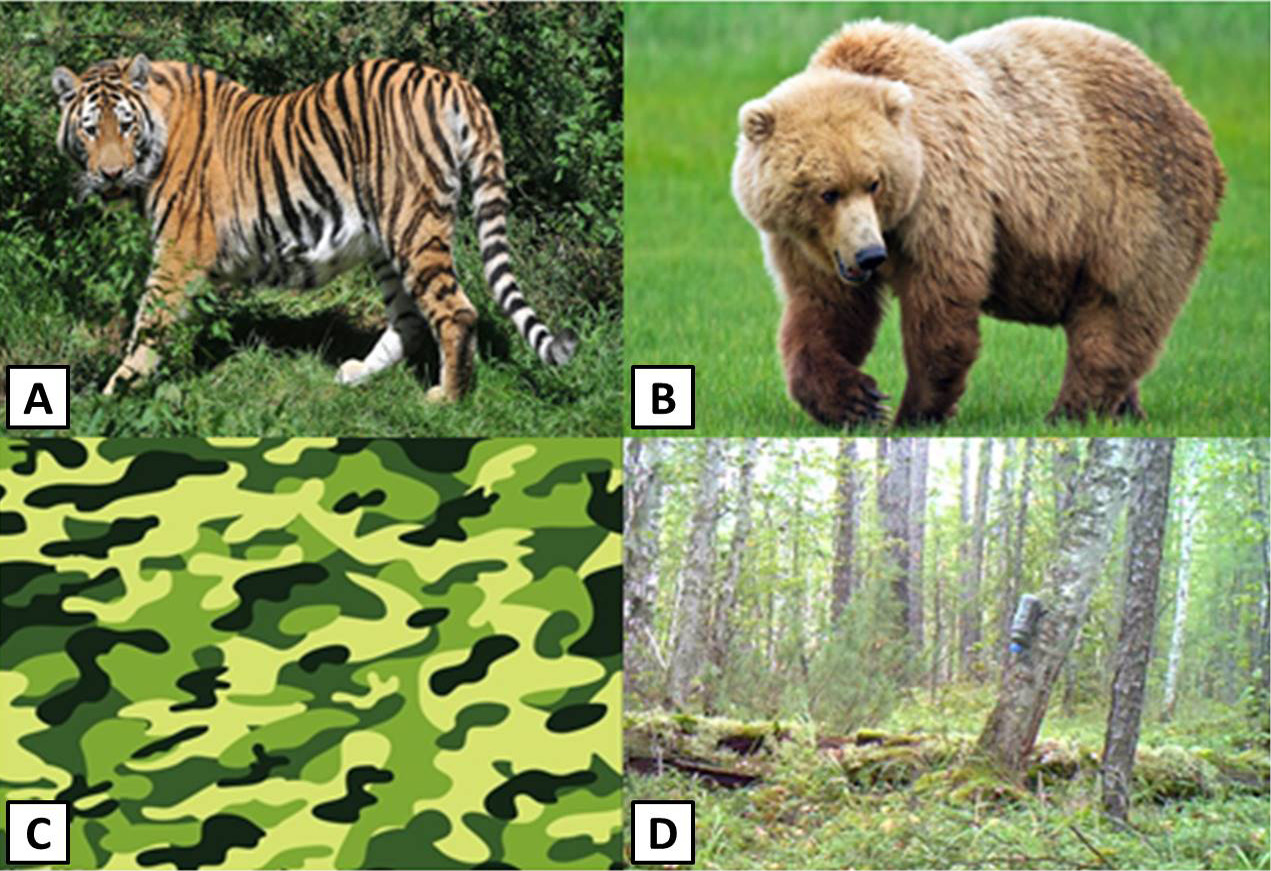
Experimental sites and camera trap distribution in Hanma National Nature Reserve. Black boxes indicate reserve areas selected for experimental treatment group sites as determined by the fishnet method in ArcGIS 9.3. Then A- visual cue experiment (Aa- tiger, Ab- bear, Ac- control), and the odour cue experiment comprises of (Ba- tiger, Bb- control). Tiger visual (Aa) includes a life-size photo of a standing tiger printed on a canvas which is tied to two trees that are side by side, with a camera tied to one of the trees; the same size and settings were for the bear visual (Ac). For the control visual (Ac), a canvas with the same size as tiger and bear visual cues was printed with vegetation colour to mimic the habitat and then tied side by side to two trees with a camera tied to one of the trees to record visitation incidences. For the tiger odour cue experiment (Ba, b), a plastic bottle with tiger feces (i.e., Ba groups) was tied to a tree, and then a camera is tied to the opposite tree to record the visitation rate; the same was done to odour cue control (Bb) groups, but here the bottle was filled with soil. Finally, there were cameras at no treatment sites indicated as white round; spots with neither treatment nor control. Red circles indicate individual camera trap sites each of which includes one motion-triggered camera.
Experiment, and control visual and odour cues. From top left to bottom right is a tiger, bear, and control visual cues; and tiger odour cue, respectively. Tiger odour control cue looks similar to tiger control cue with the differences in their content (tiger feces vs. soil).
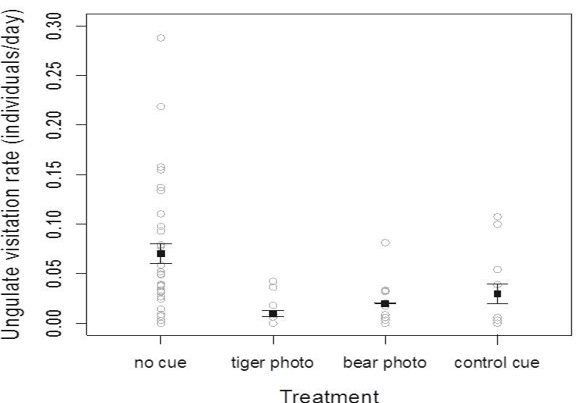
Ungulate visitation rates (individuals/day) at camera trap sites under four different treatments: no cue, predator photo cues (amur tiger/brown bear), and a control cue. Treatment significantly predicted ungulate visitation rate (X23 = 18.53, P <0.001; Table I). Visitation to sites with the tiger cue and the bear cue differed significantly from visitation to sites where no cue was present (tiger photo Z = -4.51, P < 0.0001; bear photo Z = -2.97, P = 0.015, respectively). Visitation to no cue and control cue sites did not differ (Z = -1.65, P = 0.35). Visitation responses to tiger and bear cues were not statistically different (Z = -1.46, P = 0.46).
Predator (mesopredators and top predators combined) visitation rates (individuals/day) at camera trap sites under four different treatments: no cue, predator photo cues (amur tiger/brown bear), and a control cue. Combined mesopredators and top predators showed a small effect of treatment on visitation rates (X23 = 7.43, P = 0.06; Table II): post-hoc testing showed that the only significant difference between cue types was that visitation to bear cue sites was slightly higher than visitation to tiger cue sites (Z = -2.62, P < 0.05).


