Mechanism of Action of Velvet Antler Polypeptide in Improving Mild Cognitive Impairment in Rats
Xiao-Wei Huang1,2, Mei-Li Liu1, Jin-Ji Wang1, Yue-Xin Liu3, Zhe Lin1, Chun-Shu Rong4* and Ji-Xiang Ren4*
1School of Pharmacy, Changchun University of Chinese Medicine, Changchun 130117, China
2Northeast Asia Institute of Traditional Chinese Medicine, Changchun University of Chinese Medicine, Changchun 130117, China
3School of Pharmaceutical Sciences, Jilin Medical University, Jilin 132013, China
4Affiliated Hospital, Changchun University of Chinese Medicine, Changchun 130021, China
Fig. 1.
Representative heat maps of the movement of rats within an open-field box over a two-minute period.
Notes: Control, control group; Model, model group; PIR, Piracetam group; VAPH, 300 mg/kg VAP group; VAPL, 200 mg/kg VAP group. Red indicated more time, and blue indicated less or no time. The time periods were given in seconds.
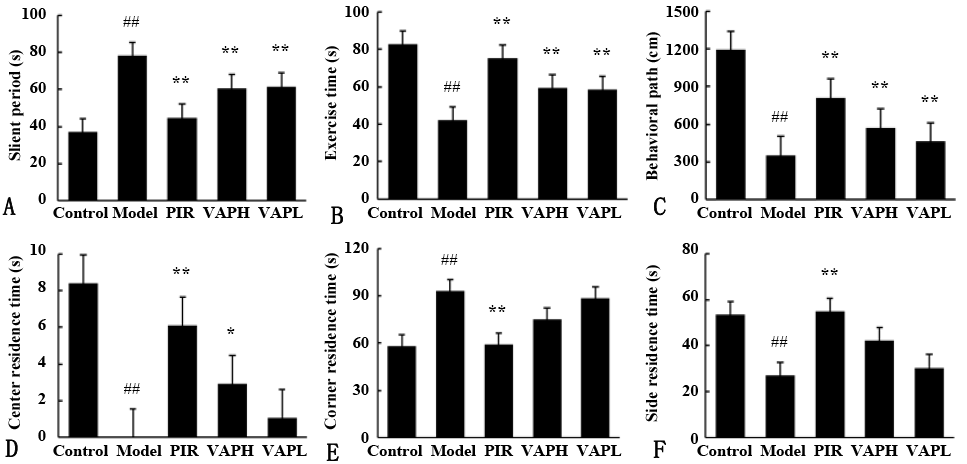
Fig. 2.
Results of the open field test during a 2-min period for each group of rats.
(A) Slient period: total inactivity time; (B) Exercise time: total activity time; (C) Behavioral path: total travel distance; (D) Center residence time: time spent in the central area; (E) Corner residence time: time spent in the corners; (F) Side residence time: time spent on the side.
Notes: Data are presented as mean ± SD (n = 10 per group). Compared with Control group, ## P <0.01; Compared with Model group, * P <0.05, ** P <0.01.
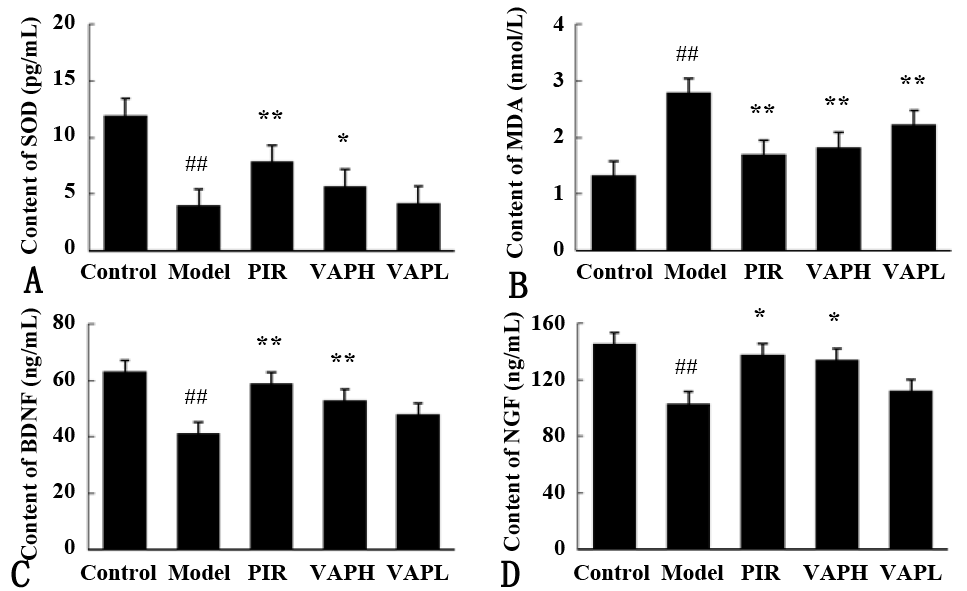
Fig. 3.
Contents of SOD (A), MDA (B), BDNF (C) and NGF (D) in serum of rats in each group.
Notes: Data are presented as mean ± SD (n = 10 per group). Compared with Control group, ## P <0.01; Compared with Model group, * P <0.05, ** P <0.01. SOD, superoxidase dismutase; MDA, malondialdehyde; BDNF, brain-derived neurotrophic factor; NGF, neural growth factor.
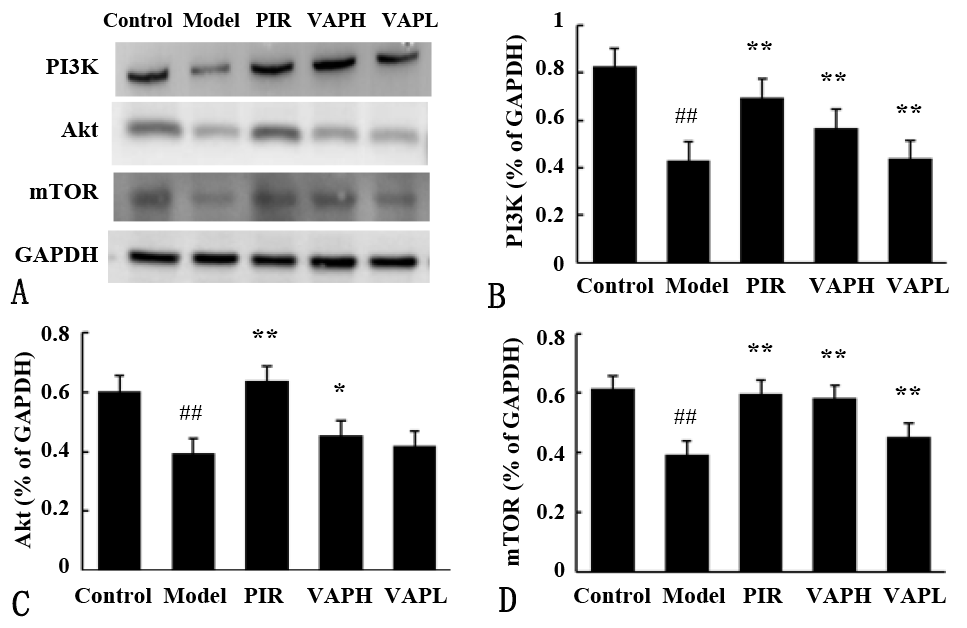
Fig. 4.
Expression levels of PI3K, Akt and mTOR proteins in the hippocampus tissue of rats in each group.
Notes: (A) Western blot analysis; (B–D) Quantification of PI3K, Akt and mTOR in five groups. Data are presented as mean ± SD (n = 10 per group). Compared with Control group, ## P <0.01; Compared with Model group, * P <0.05, ** P <0.01.
Table II.
Contents of amino acid components in VAP.
*, essential AA; E, total essential AA content; T, total AA content.


