
Phenotypic Characterization and Canonical Correlation Analysis at Weaning and Eight Month Period of Indonesian Etawah (PE) Goats


Review Article
Phenotypic Characterization and Canonical Correlation Analysis at Weaning and Eight Month Period of Indonesian Etawah (PE) Goats
Ahmad Fahrudin Husen1, Suyadi1, Yudi Parwoto2, Muhammad Sairi2, Veronica Margareta Ani Nurgiartiningsih1*
1Faculty of Animal Science, Universitas Brawijaya, Malang 65145, East Java, Indonesia; 2BPTU-HPT Pelaihari, Ministry of Agriculture Republic Indonesia, Tanah Laut Regency, South Kalimantan, Indonesia.
Abstract | The Indonesian Etawah (PE) goat breed, valued for its dual-purpose meat and milk production and high adaptability, dominates the local goat population in Indonesia and plays a crucial role in supporting smallholder farmers throughout the country. This study aimed to identify early predictors of growth and potential selection criteria for more effective breeding programs. Data were collected from 210 PE goats at weaning and eight months of age. Nine morphometric traits were measured: body weight (BW), body length (BL), withers height (WH), chest girth (CG), chest depth (CD), hip height (HH), ear length (EL), ear width (EW), and mane ruff length (MRL). The methods used in this study included descriptive statistics, Pearson correlation analysis, and canonical correlation analysis (CCA). Results showed significant sexual dimorphism, with males exhibiting larger body sizes BW (27.15±5.39 kg vs. 24.53±3.85 kg in females, P ≤ 0.01), indicating potential for sex-specific breeding strategies. Strong correlations between BW and CG (r=0.819, P ≤ 0.01) suggest these measurements could serve as reliable proxies for growth potential. The strong CCA (0.839, P < 0.01) between traits at weaning and eight months, with significant contributions from BW, CG at weaning, and MRL at eight months to the canonical variables, indicates that early measurements can effectively predict later growth. These findings provide valuable insights for optimizing PE goat breeding strategies, potentially improving production efficiency and economic returns in Indonesian goat farming.
Keywords | Canonical correlation analysis, Indonesian etawah (PE) goats, Morphometric traits, Growth prediction, Sexual dimorphism, Breeding efficiency
Received | September 04, 2024; Accepted | October 21, 2024; Published | March 18, 2025
*Correspondence | Veronica Margareta Ani Nurgiartiningsih, Faculty of Animal Science, Universitas Brawijaya, Malang, East Java, Indonesia; Email: [email protected]
Citation | Husen AF, Suyadi, Parwoto Y, Sairi M, Nurgiartiningsih VMA (2025). Phenotypic characterization and canonical correlation analysis at weaning and eight month period of indonesian etawah (pe) goats. Adv. Anim. Vet. Sci. 13(4): 798-808.
DOI | https://dx.doi.org/10.17582/journal.aavs/2025/13.4.798.808
ISSN (Online) | 2307-8316; ISSN (Print) | 2309-3331
Copyright: 2025 by the authors. Licensee ResearchersLinks Ltd, England, UK.
This article is an open access article distributed under the terms and conditions of the Creative Commons Attribution (CC BY) license (https://creativecommons.org/licenses/by/4.0/).
INTRODUCTION
In 2023, Indonesia had a population of 18,560,835 local goats, contributing 50.95% of the total 37,844,420 goats in Southeast Asia (BPS-Statistics, 2023; FAO, 2023). The Indonesian Etawah goat, commonly known as Peranakan Etawah (PE), a result of crossbreeding local Kacang goats with exotic Etawah goats from India, constituted the majority of the goat population (Mudawamah et al., 2021; Suyadi et al., 2021). Developed for both milk and meat production (Sodiq and Abidin, 2008), PE goats have been officially recognized and bred in Indonesia for more than eleven years since the Ministerial Decree of Agriculture (No.695/Kpts/PD.410/2/2013). The Indonesian government recognized PE goats as a local livestock breed, along with other goat breeds such as Senduro, Boerka Galaxy Agrinak, Gembrong, Kaligesing, Kejobong, and Saburai (Direktorat Pembibitan dan Produksi Ternak 2020).
Recent studies have highlighted the importance of morphometric traits in goat breeding. Yakubu et al. (2022) demonstrated strong correlations between body measurements and productivity in Red Sokoto goats, while Mekuriaw et al. (2016) used multivariate analysis to characterize Ethiopian goats for breeding programs. In Indonesia, Sodiq (2012), explored morphometric variations in PE goats across different regions, emphasizing the need for location-specific breeding strategies. Despite the recognized potential of morphometric analysis to improve breeding efficiency, a significant knowledge gap persists regarding the correlation between early-life measurements and subsequent growth in PE goats. Further research is needed to optimize breeding programs for PE goats.
Selection efforts are carried out through planned breeding programs to sustainably improve the genetic quality of PE goats. According to FAO (2012), phenotypic characterisation is a crucial step in designing planned breeding programmes, ensuring the selection process for local goat breeds can be achieved. Coefficient of variation (CV) is a crucial indicator in assessing genetic diversity for breeding programs. Asomah-Boaheng and Sam (2016), in their study on sheep breeds, established that a CV between 5% and 20% indicates optimal diversity for selection. This finding provides a valuable benchmark for evaluating the potential for genetic improvement in livestock populations. In the context of PE goats, Ilham et al. (2023) reported moderate to high CV for various morphometric traits, suggesting significant potential for genetic improvement through selective breeding.
PE goats play a crucial role in Indonesia’s rural economy and food security. As a source of both meat and milk, they contribute significantly to smallholder farmers’ livelihoods. Sodiq and Abidin (2008) reported that PE goats can produce 1-3 liters of milk per day, providing a vital source of nutrition in areas where cow’s milk is scarce. Furthermore, Warmadewi et al. (2023) found that PE goat rearing can increase rural household income by up to 30%. Culturally, these goats are essential for religious festivals like Eid al-Adha, where their demand spikes annually (Baharuddin et al., 2023). Given their economic and cultural importance, improving PE goat breeding efficiency could have far-reaching impacts on rural development and food security in Indonesia.
The complex interrelationships among morphometric traits at different developmental stages necessitate sophisticated analytical approaches to optimize selection criteria in animal breeding programs. While Pearson correlation has been widely employed to elucidate trait relationships, its efficacy is limited when dealing with multiple interconnected variables (Tahtila et al., 2012). Canonical correlation analysis (CCA) emerges as a robust alternative, capable of describing relationships between two sets of variables by calculating maximally correlated linear combinations (Cankaya and Kaylaap, 2007). This method has been successfully applied in various contexts, including the analysis of age-related trait correlations in Merino sheep (Sahin et al., 2001) and Kid goats (Mokena and Tyasi, 2021).
The present study extends this analytical framework to PE goats, addressing a significant gap in the literature. By applying CCA to estimate relationships between nine morphometric traits measured at weaning and eight months, this research offers a more comprehensive understanding of PE goat growth patterns than previous studies relying on simple correlation or regression analyses (Dakhlan et al., 2021; Yakubu et al., 2022). This study aims to address the knowledge gap regarding the relationship between early-life morphometric measurements and later growth patterns in PE goats by characterizing traits at weaning and eight months, analyzing trait correlations across ages, and evaluating early measurements as predictors of future growth, thereby potentially optimizing selection criteria for PE goat breeding programs.
MATERIALS AND METHODS
Experimental Design
All animals were handled with minimal stress during measurements, and all procedures conducted were non-invasive. Throughout the study period, the animals were provided with adequate nutrition, water, and shelter, alongside regular health checks performed by licensed veterinarians to ensure their well-being. Ethical approval for this research was granted by Brawijaya University under ethical number 003-KEP-UB-2024. The research was conducted at BPTU-HPT Pelaihari, Sungai Jelai, Tambang Ulang, Tanah Laut Regency, South Kalimantan coordinates at (3°41’54.4”S 114°44’11.8”E) in Figure 1. This area was selected due to its large population of PE goats, making it one of the breeding centres in Indonesia. This study involved a sample of 210 PE goats, determined based on FAO (2012) guidelines for phenotypic characterization and representing approximately 10% of the PE goat population at the breeding center, comprising 105 weanlings (52 males and 53 females) as shown in Figure 2, and 105 eight-month-old goats (54 males and 51 females) as presented in Figure 3.
This sample size allows for population parameter estimation with a 95% confidence level and ±6% margin of error. It also considers the variability of morphometric traits observed in preliminary studies, ensuring adequate statistical power (>80%) to detect biologically significant differences between groups. While generalization should be approached with caution, this sample size is sufficiently large to provide a representative overview of PE goat morphometric characteristics at the research location, balancing statistical robustness with logistical constraints. The management system used was flock management, where the animal population was divided based on age, sex, and health. Water was provided ad libitum, and feeding was done twice daily (morning and afternoon). Concentrate feed was given in the morning, followed by Pennisetum purpureum cv. Mott forage, and in the afternoon, gamal forage was provided.
Table 1: Reference points of body weight and morphometric measurements in PE Goats.
|
Variable |
Measurement Scale |
|
Body Weight (BW) |
Measurement using hanging digital scale with kilograms (kg) as the unit of measurement. |
|
Body Length (BL) |
Measure the length in centimeters (cm) from the point of the WHoulder (tuberositas humeri) to the pin bone (tuber ischii) using a measuring stick |
|
Withers Height (WH) |
Measure straight-line length in centimeters (cm) from the ground to the highest point of the withers behind the hump, parallel to the forelegs. |
|
Chest Girth (CG) |
Measured around the chest behind the hump using a measuring tape with the unit in centimeters (cm). |
|
Chest Depth (CD) |
Measured vertically on the side of the chest directly behind the hump using a measuring tape with the unit in centimeters (cm). |
|
Hip Height (HH) |
Measure the higth in centimeter (cm) from the ground to the top of the hip bone (tuber coxae). |
|
Ear Length (EL) |
Measure the length in centimeter (cm) from the base to the tip of the ear using a measuring tape. |
|
Ear Width (EW) |
Measured at the widest part of the ear, with the ear naturally spread, using a measuring tape with the unit in centimeters (cm). |
|
Mane Ruff Length (MRL) |
Measured by selecting several strands of mane hair at the longest part, from the base of the hair to the tip, using a measuring tape with the unit in centimeters (cm). |
Data Collection Procesdures
Data were measured based on nine morphometric traits according to the BSN (2015) and FAO (2012) descriptors for the phenotypic characterisation of goats. Prior to data collection, the research team underwent an intensive one-week training program to standardize measurement techniques. This training included practical demonstrations, inter-rater reliability tests, and instrument calibration. To minimize variability, each measurement was performed three times by two independent observers, with the average value used as the final measurement. If the difference between measurements exceeded 5%, the measurement was repeated. All measurements were conducted at the same time each day to avoid diurnal variations. This rigorous approach ensures high reliability and reproducibility of the morphometric data collected. The traits measured were Body Weight (BW), Body Length (BL), Withers Height (WH), Breast Girth (BG), Breast Depth (BD), Hip Height (HH), Ear Length (EL), Ear Width (EW), Mane Ruff Length (MRL) in Table 1. Livestock measuring stick was used to measure WH and HH. BW was measured using a metal frame scale with a capacity of 100 Kg. All other linear measurements were taken using a textile measuring tape. Measurements were carried out in the morning before the goats were fed, and only healthy, non-defective goats were measured.
Data Analysis and Coding
The selection of statistical methods was predicated on the research objectives and the nature of the data. To summarize the distribution of morphometric traits across all variables, descriptive statistics such as the mean, standard deviation, and coefficient of variation were utilized. For comparing sex differences, the t-test was employed due to its effectiveness in comparing two independent groups, with significance determined at the P<0.01 threshold. Levene’s test for equality of variances was applied to assess the homogeneity of variances between male and female groups for each morphometric trait. The test is essential for ensuring that the assumption of equal variances is met, as a significant result (P<0.05) would indicate a violation of this assumption, requiring adjustments to the interpretation of t-test results.
Pearson correlation was chosen for its ability to quantify the strength and direction of linear relationships between pairs of morphometric variables. This method is appropriate for continuous, normally distributed data as present in this study. Canonical Correlation Analysis (CCA) was chosen for its suitability in exploring relationships between two sets of multidimensional variables, especially for comparing morphometric traits at distinct growth stages. Specifically, CCA was applied to examine the correlations between the linear combinations of independent variables at weaning (X-set) and dependent variables at eight months (Y-set) in the total population of PE goats (n = 210). The mathematical model for CCA can be represented as follows (Hotelling, 1936):
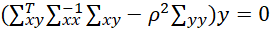
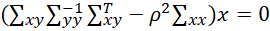
∑xyT: Denotes the transpose of ∑xy represents the covariance matrix between variable sets X and Y.
∑xx -1 and ∑yy -1: Represent the covariance matrices within each variable set.
Ρ: Denotes the canonical correlation, and x and y are vectors of canonical coefficients.
CCA seeks to determine linear combinations of variables from each set (U for set X and V for set Y) that optimize the correlation between the two groups. This method allows for uncovering intricate multivariate relationships that may not be easily observed through more straightforward analyses (Gunderson and Muirhead, 1997). The results of the CCA satisfy several essential properties, including Corr(Ui, Vj) = 0, Corr(Ui, Ui) = 0, Corr(Vi, Vj) = 0 for i ≠ j, Corr(Ui, Vi) = ρi for i = j, where ρi is the canonical correlation coefficient, representing the strength of the relationship between the i-th pair of canonical variables (Tuzhilina et al., 2023).
This comprehensive statistical analysis, conducted using R Studio 4.4.1, facilitated an in-depth examination of the complex interrelations among morphometric traits and their developmental patterns in PE goats, thus providing a robust foundation for understanding their growth. The statistical procedures were executed through various R packages, including ‘CCA’, ‘tidyverse’, ‘assertthat’, ‘dplyr’ for descriptive analysis, and ‘stats’ for conducting t-tests. In the canonical correlation analysis (CCA), the first set of variables (Xnxp) comprised nine morphometric traits measured at weaning, while the second set (Ynxq) represented the same nine traits assessed at eight months of age. This approach allowed for a precise comparison of morphometric development between these two critical growth stages.
Limitations
Despite offering key insights into the morphometric traits of PE goats, this study has several limitations that should be recognized. The sample being sourced from a single breeding site may affect the broader applicability of the findings to the overall PE goat population in Indonesia. Site-specific environmental and management factors may have influenced the goats’ growth and development, variables that were not fully controlled within the study. Additionally, measurements were collected at only two specific points in time (weaning and eight months), which might not fully reflect the continuous and complex growth dynamics throughout the animals’ lifespan. The study also did not include genetic variation analysis, limiting the exploration of genetic contributions to the observed morphometric traits. Even though rigorous training and standardized protocols were followed, potential measurement biases associated with manual morphometric measurements cannot be entirely excluded. Future research should aim to overcome these limitations by expanding the study to multiple locations, conducting more frequent measurements, and including genetic analysis. Nonetheless, this research serves as a solid starting point for understanding PE goat morphometric traits and their developmental patterns, paving the way for further exploration in the field of animal breeding.
RESULTS AND DISCUSSION
Morphometric Measurements of PE Goat
Weaning age morphometric parameters identified differences between male (n=52) and female (n=53) goats Table 2. Body Weight (BW) of males (15.19±2.60 kg) and females (14.72±2.98 kg) exhibited no significant difference (t = 0.863, p = 0.39). Levene’s test confirmed homogeneous variance (F = 2.654, p = 0.106). Body Length (BL) of males (54.60±3.62 cm) and females (53.32±3.87 cm) showed no significant difference. Withers Height (WH) demonstrated similar development in males (56.97±3.37 cm) and females (56.30±3.34 cm). Significant differences (P ≤ 0.01)
Table 2: Sexual Dimorphism in Morphometric Measurements of PE Goats at Weaning and Eight Months.
|
Variable |
Parameters |
Weaning Period |
Eight-Month Period |
||||
|
Levene's test (P.Value) |
Male (n=52) |
Female (n=53) |
Levene's test (P.Value) |
Male (n=54) |
Female (n=51) |
||
|
Mean±SD |
0.106 |
14.72±2.98 |
0.023 |
27.15±5.39 a |
24.53±3.85 b |
||
|
Body Length (Cm) |
Mean±SD |
0.177 |
54.60±3.62 |
53.32±3.87 |
0.000 |
67.80±6.80 a |
63.63±3.42 b |
|
Withers Height (Cm) |
Mean±SD |
0.771 |
56.97±3.37 |
56.30±3.34 |
0.002 |
68.02±5.31 a |
64.73±3.58 b |
|
Chest Girth (Cm) |
Mean±SD |
0.065 |
53.23±2.83 a |
51.91±3.66 b |
0.053 |
64.81±4.59 a |
62.02±3.33 b |
|
Chest Depth (Cm) |
Mean±SD |
0.849 |
24.58±2.03 a |
23.62±2.04 b |
0.002 |
29.69±3.81 a |
26.86±2.65 b |
|
Hip Height (Cm) |
Mean±SD |
0.587 |
58.77±3.43 |
58.13±3.51 |
0.002 |
70.31±5.45 a |
66.84±3.78 b |
|
Ear Length (Cm) |
Mean±SD |
0.001 |
25.39±2.45 |
25.10±1.58 |
0.447 |
28.82±2.54 |
28.99±2.92 |
|
Ear Width (Cm) |
Mean±SD |
0.052 |
7.77±1.00 |
7.52±0.71 |
0.237 |
8.98±.93 |
8.89±1.02 |
|
Mane Ruff Length (Cm) |
Mean±SD |
0.874 |
5.58±1.39 |
5.21±1.36 |
0.762 |
9.93±1.60 |
9.95±1.57 |
Note: a.b Means in rows with different superscripts differ significantly (P ≤ 0.01) between sexes.
emerged in Chest Girth (CG), males (53.23±2.83 cm) exceeding females (51.91±3.66 cm), and Chest Depth (CD), males (24.58±2.03 cm) surpassing females (23.62±2.04 cm). Hip Height (HH), Ear Length (EL), Ear Width (EW), and Mane Ruff Length (MRL) parameters revealed no significant intersexual differences at weaning age.
Eight-month-old goats exhibited pronounced sexual dimorphism between males (n=54) and females (n=51) Table 2. BW_8 demonstrated significant differences (t = 2.859, p = 0.005) between males (27.15±5.39 kg) and females (24.53±3.85 kg). Levene’s test indicated significantly different variances (F = 5.344, p = 0.023). BL_8 in males (67.80±6.80 cm) significantly exceeded females (63.63±3.42 cm) (P ≤ 0.01). WH_8 in males (68.02±5.31 cm) significantly surpassed females (64.73±3.58 cm) (P ≤ 0.01). CG_8 in males (64.81±4.59 cm) exceeded females (62.02±3.33 cm) (P ≤ 0.01). CD_8 in males (29.69±3.81 cm) surpassed females (26.86±2.65 cm) (P ≤ 0.01). HH_8 in males (70.31±5.45 cm) significantly exceeded females (66.84±3.78 cm). EL_8, EW_8, and MRL_8 exhibited no significant intersexual differences.
Boxplot visualization in Figure 4 illustrates morphometric parameter differences. Weaning age data revealed outliers in BW, CD, and EW, indicating greater intragroup variation, while parameters like HH and BL exhibited relatively small variability ranges. Eight-month data showed significant outliers in BW_8 and EL_8, highlighting individuals with values deviating substantially from the mean. Parameters CG_8 and CD_8 exhibited clear differences, potentially indicating variations in growth patterns at this stage.
Pearson Correlation
The Pearson correlation analysis of morphometric measurements in PE goats revealed significant associations (P < 0.01) among various parameters across developmental stages, as shown in Table 3. At weaning age, body weight (BW) displayed strong positive correlations (P < 0.01) with key morphometric traits: chest girth (CG) (r = 0.819), body length (BL) (r = 0.782), withers height (WH) (r = 0.776), and hip height (HH) (r = 0.719). These robust correlations suggest a proportional increase in various body dimensions concurrent with weight gain. This aligns with the biological expectation of coordinated growth during early developmental stages. Particularly, the strong correlation between WH and HH (r = 0.922) indicates synchronized vertical growth, potentially reflecting coordinated skeletal development along the animal’s longitudinal axis.
At eight months of age, correlation analysis consistently demonstrated highly significant relationships between body weight (BW_8) and morphometric parameters. BW_8 was strongly correlated with hip height (HH_8) (r = 0.885), chest girth (CG_8) (r = 0.852), withers height (WH_8) (r = 0.843), and body length (BL_8) (r = 0.811). The persistence of these strong correlations suggests that the proportional growth pattern observed at weaning is maintained as
Table 3: Pearson Correlations Between Body Weight and Morphometric Traits in PE Goats.
the animals mature. Furthermore, the exceptionally strong correlation between WH_8 and HH_8 (r = 0.972) at eight months supports the concept of synchronized vertical growth during this critical developmental phase.
While these correlations offer valuable insights into PE goat growth patterns, it is crucial to interpret them within the context of their limitations and biological implications. The strong associations between body weight and morphometric traits suggest coordinated growth, likely reflecting underlying physiological processes such as synchronized skeletal development and proportional organ growth. To address these limitations and improve the robustness of the findings, future studies should aim to control for confounding factors and apply more advanced statistical approaches, such as multivariate analyses or longitudinal studies. These methods would not only refine the interpretation of the observed correlations but also help elucidate the complex interactions influencing growth and development in PE goats.
Canonical Correlation Analysis (CCA)
The results of the Canonical Correlation Analysis (CCA) on PE goats indicate a highly significant relationship (P < 0.01) between growth parameters at weaning and eight months of age. As shown in Table 4, the first pair of canonical variables (U1V1) exhibits a strong positive correlation (r = 0.839, P < 0.001), reflecting a robust association between morphometric traits at these two developmental stages. This high correlation suggests that body mass and other key morphometric traits at weaning are closely linked to growth patterns at eight months. The variability observed in the data, consistent with the relatively high coefficients of variation (CV) for several traits, highlights the inherent diversity within the population.
Table 4: Summary result for the CCA.
|
Pair of Canonical |
Canonical Correlation |
Square Canonical |
Eigenvalue |
df |
Likelihood Ratio |
Probability Pr>F |
|
U1 V1 |
0.839 |
0.704 |
2.377 |
81 |
0.146 |
0.000 |
|
U2 V2 |
0.470 |
0.221 |
0.283 |
64 |
0.493 |
0.385 |
|
U3 V3 |
0.412 |
0.170 |
0.205 |
49 |
0.633 |
0.708 |
|
U4 V4 |
0.341 |
0.116 |
0.131 |
36 |
0.763 |
0.901 |
|
U5 V5 |
0.252 |
0.063 |
0.068 |
25 |
0.863 |
0.963 |
|
U6 V6 |
0.240 |
0.057 |
0.061 |
16 |
0.921 |
0.956 |
|
U7 V7 |
0.130 |
0.017 |
0.017 |
9 |
0.977 |
0.988 |
|
U8 V8 |
0.065 |
0.004 |
0.004 |
4 |
0.994 |
0.966 |
|
U9 V9 |
0.043 |
0.002 |
0.002 |
1 |
0.998 |
0.675 |
Furthermore, Table 4 demonstrates that the first canonical pair (U1V1) shows a canonical correlation of 0.839, with a squared canonical correlation of 0.704 (70.4%). This indicates that a substantial portion of the variance in one set of variables is explained by the variance in the other set. The eigenvalue of 2.377 underscores the significant contribution of the first canonical pair in explaining the relationship between the two sets of variables. Figure 5 visually supports these findings, presenting a scatterplot of the canonical correlation that illustrates the strong relationship between the first canonical variables of both sets. The Likelihood Ratio of 0.146, coupled with the highly significant p-value (P < 0.001), confirms that the CCA model fits the data well, justifying the rejection of the null hypothesis for the first canonical pair. In contrast, the subsequent pairs, such as U2V2 (r = 0.470), display smaller and statistically non-significant correlations, indicating that only the first canonical pair contributes meaningfully to explaining the variance between the two sets of variables.
The standardized canonical coefficients for the first canonical pair (U1V1), as presented in Table 5, reveal that the first canonical variable (U1) is primarily influenced by body weight (BW) and chest girth (CG) at weaning, while the second canonical variable (V1) at eight months is dominated by mane ruff length (MRL_8). These findings suggest that early growth factors, such as body mass and chest girth, strongly influence subsequent development, with secondary traits like mane ruff length becoming more pronounced as the animals mature. The following canonical equations represent the optimal linear combinations of these variables:
U1= (-0.72 BW)- (0.09 BL) + (0.23 WH) - (0.38 CG) + (0.03 CD)- (0.07 HH) + (0.06 EL) - (0.04 EW) - (0.12 MRL)
V1= (0.07 BW_8) - (0.07 BL_8) - (0.05 WH_8) + (0.08 CG_8) - (0.24 CD_8) - (0.05 HH_8) + (0.02 EL_8) - (0.02 EW_8) - (0.97 MRL_8)
Interpretation of these equations indicates that decreases in BW, BL, CG, HH, and EW at weaning age tend to be associated with similar decreases in these variables at eight months, suggesting a consistent pattern of growth. The biological significance of these relationships lies in the fact that early development, characterized by body mass and skeletal growth, is maintained throughout later stages of growth. At weaning, traits like BW and CG strongly influence the overall body structure, while at eight months, secondary traits such as mane ruff length (MRL_8) become more pronounced, likely reflecting maturity and secondary development characteristics.
The canonical loadings and cross-loadings detailed in Tables 6 and Tables 7 substantiate the significant influence of body weight (BW) and chest girth (CG) in shaping the first canonical variable (U1) at weaning age, while mane ruff length (MRL_8) emerges as the dominant contributor to the second canonical variable (V1) at eight months. This progression underscores the transition from primary growth traits, such as body mass, to secondary traits, including hair growth, as the animals mature. Furthermore, as indicated in Table 8, the first canonical variable (U1) accounts for 43% of the total variance in morphometric traits at weaning, with a redundancy of 14% for traits at eight months. This finding suggests that while U1 captures a substantial portion of the variance in early-stage morphometric traits, it also explains a moderate amount of variance in traits associated with later growth. The results highlight the pivotal roles of BW, CG, and MRL in driving the overall growth trajectory and development of PE goats between weaning and eight months of age.
Genetic improvement strategies for the conservation and sustainable utilization of Indonesian indegenous livestock genetic resources must be predicated on phenotypic characterization assessments of extant populations. Indonesia possesses a large and diverse small ruminant population, contributing significantly to rural livelihoods and national income (Tiesnamurti et al., 2020). Recent studies by Baharuddin et al. (2023) revealed a 34% increase in goat production from 2020 to 2022, primarily driven by demand for religious ritual such as Eid al-Adha and Aqiqah. This productivity enhancement in PE goats implies sustained population growth, underscoring the necessity for selective breeding efforts to improve production performance efficiently. For instance, selection based on breeding values for economically important traits such as growth rate and milk production can be applied to enhance overall productivity. These findings align with global trends in small ruminant development, as reported by Monau et al. (2020) in Botswana, emphasizing the importance of genetic and phenotypic characterization in sustainable breeding programs.
This research focused on the morphometric analysis of PE goats, revealing significant defferences in body measurements (P<0.01) between males and females, particularly at eight months of age. These findings confirms pronounced sexual dimorphism in this breed, with males consistently exhibiting larger body dimensions compared to females across critical parameters. This phenomenon aligns with the findings of Ma`rufah et al. (2023) in PE goat popu lations in Indonesia. However, it is noteworthy that some
studies, such as that conducted by Sodiq et al. (2019), found smaller variations between sexes in certain PE goat populations, indicating the potential influence of environmental or management factors on the expression of sexual dimorphism. The observed sexual dimorphism has important implications for breeding strategies, as discussed by Manzi et al. (2019) in their study of Red Sokoto goats in Nigeria. They suggest that morphometric differences between sexes should be considered in developing gender-specific selection indices to maximize the genetic potential of both sexes.
The analysis of morphometric variability revealed coefficients of variation (CV) ranging from 5.32% to 22.28% across the studied parameters, indicating substantial phenotypic diversity within the PE goat population. These moderate to high CV values suggest considerable genetic variability, a crucial prerequisite for effective selective breeding programs. However, it is important to acknowledge that this phenotypic variability is also influenced by environmental factors. A study by Lopes et al. (2012) on goats in Brazil demonstrated that factors such as management systems, feed availability, and climatic conditions can significantly contribute to morphometric variation. Consequently, breeding programs should consider genotype-environment interactions to optimize outcomes. The observed range of CV is consistent with the findings from recent multivariate characterization studies on PE goats by Guntoro et al. (2023) and Ilham et al. (2023), wich reported diverse moderate CV (5% to 20%) for male and female cohorts. This phenotypic plasticity, as evidenced by the moderate CV values, implies that genetic improvement through directed selection can yield significant responses in morphometric traits. These findings are corroborated by Mekuriaw et al. (2016) study on Ethiopian goats, which demonstrated that high phenotypic variability can be leveraged for effective breeding programs, particularly when combined with genomic information.
The morphometric characteristics of PE goats exhibited strong positive correlation between body weight (BW) and most other morphometric traits, both at weaning and eight months of age. Three primary body measurements, namely body length (BL), withers height (WH), and chest girth (CG), showed very strong correlation with BW at weaning BL (r = 0.782); WH (r = 0.776); CG (r = 0.819). At eight months, BW strongly correlated with WH (r = 0.843); CG (r = 0.852); and HH (r = 0.855). All observed correlations were highly significant (P<0.01), with stronger correlations at eight months, indicating that these relationships intensify as the goats mature. This research supports the findings of Talukder and Choudhury (2018), Dige et al. (2021), and Yakubu et al. (2022), which reported strong positive correlations between BW and morphometric traits across various goat breeds. The high correlation values for certain morphometric traits can be used to develop selection criteria, as demonstrated by Dakhlan et al. (2021) in predicting adult body weight. Furthermore, a recent study by Ofori et al. (2021) on West African Dwarf goats suggests that strong morphometric correlations can be used to develop more accurate selection indices for genetic improvement.
Further confirmation of the pearson correlation values for the nine parameters was obtained through Canonical Correlation Analysis (CCA), wich elucidating the reciprocal relationship between variables measured at weaning and eight months of age. The first canonical correlation (U1V1) exhibited a highly significant value (0.839, P < 0.01), accounting for 70.4% of the variation in the data, thus indicating a strong relationship between the two sets of variables, as presented in Table 5. These results are consistent with findings by Çankaya and Kayaalp (2007) and Tahtali et al. (2012), who reported significant canonical correlations (P < 0.01) between morphometric measurements at different growth stages. The standardised canonical coefficients for the first pair of canonical variables (U1V1), shown in Table 6, indicate that increases in WH, CD, and EL at weaning are associated with decrease in BL_8, WH_8, CD_8, HH_8, EW_8, and MRL_8 at eight months of age, while BW_8, CG_8, and EL_8 at eight months of age increase. These findings expand our understanding of PE goat growth dynamics, aligning with a recent study by Boujenane et al. (2016) on Draa goats in Morocco, which employed CCA to identify complex growth patterns and their relationship to productivity.
Variables with higher canonical loadings contributed more significantly to the multivariate relationship between
Table 7: Cross loading of the original variables with opposite canonical variables.
morphometric measurements at weaning and eight months, as demonstrated in Table 6. Loadings for eight-month variables indicated that MRL_8 and BW_8 have a more substantial influence in shaping V1, while BW and CG had more influence in forming U1. Cross-loadings analysis Table 7 revealed that BW and MRL_8 provide the largest contributions to the variance of U1 and V1, respectively. This suggests that weaning age influences BW as a growth characterisation metric, while eight-month of age impacts MRL_8, which is used as a criterion in local goat competitions. CCA results reveal that canonical variables explain 20% of the total variation at eight months, with a redundancy size of 14% for U1 variables. At weaning, 43% of the variation was explained by canonical U1, with a redundancy size of 30% for V1 variables, as demonstrated in Table 8.
Table 8: The explained total variation ratio by canonical variables for the variable sets.
|
X-Variable Set |
Y-Variable Set |
||||||
|
|
Variance Extracted |
Redundancy |
Variance Extracted |
Redundancy |
|||
|
U1 |
0.43 |
V1 |
0.30 |
V1 |
0.20 |
U1 |
0.14 |
These findings enrich our understanding of PE goat growth patterns and provide valuable insights for developing more targeted breeding strategies. For future research, we recommend: (1) Longitudinal studies tracking individual PE goat development from birth to adulthood to better understand growth trajectories; (2) Genomic analyses to identify genetic markers associated with key morphometric traits; (3) Investigations into genotype-environment interactions to determine how factors such as nutrition and management influence the expression of morphometric traits; and (4) Evaluation of the economic impact of various selection strategies based on morphometric traits to guide decision-making in commercial breeding programs. A recent study by Pan et al. (2015) on Black Bengal goats also employed a CCA approach to uncover complex relationships between morphometric traits and productivity, affirming the utility of this method in livestock breeding research.
CONCLUSIONS AND RECOMMENDATIONS
In conclusion, this study identified a significant relationship between the morphometric traits of Indonesian Etawah (PE) goats measured at weaning and eight months of age. Body weight (BW), chest girth (CG), and mane ruff length (MRL) emerging as key predictors of future growth. The strong positive correlation (0.839) between measurements at both stages suggests that early traits can serve as reliable indicators for predicting subsequent growth, aiding in the selection of superior livestock at weaning to enhance production efficiency. Additionally, males exhibited larger body sizes, suggesting the potential benefits of sex-specific breeding strategies. While this research provides valuable insights into PE goat breeding, it is important to acknowledge the limitations of sampling from a single location and the absence of genetic variation analysis. Future studies should involve multiple locations and include genetic analysis. These findings imply that farmers can use morphometric measurements at weaning as early selection criteria and should aim to reduce generation intervals to enhance the effectiveness of breeding programs.
ACKNOWLEDGEMENTS
The authors are grateful to the Ministry of Research and Technology of the Republic of Indonesia for supporting this research through Program Magister Menuju Doktor untuk Sarjana Unggul (PMDSU). Furthermore, gratitude is extended to all the management and staff of BPTU-HPT (Balai Pembibitan Ternak Unggul-Hijauan Pakan Ternak) the Ministry of Agriculture in South Kalimantan for their assistance in collecting and providing research samples during the research period.
NOVELTY STATEMENT
This study applies Canonical Correlation Analysis (CCA) to assess the relationship between morphometric traits in Indonesian Etawah (PE) goats at weaning and eight months. Results indicate that body weight and chest girth at weaning can predict growth and mane ruff length at eight months. This approach provides new insights into early selection criteria for breeding programs, enhancing genetic improvement strategies for PE goats in Indonesia.
AUTHOR’S CONTRIBUTIONS
Ahmad Fahrudin Husen: Conceptualization, drafting the original manuscript, collecting data, analyze statistics.
Suyadi: conceptualization, supervision.
Yudi Parwoto: Collecting data and supervision.
Muhammad Sairi: Collecting data and supervision.
Veronica Margareta Ani Nurgiartiningsih: Conceptualization, supervision.
Each author has reviewed and approved the manuscript’s published form.
Funding
This research was funded by DRTPM (Direktorat Jenderal Pendidikan Tinggi Kementerian Pendidikan dan Kebudayaan Republik Indonesia) through the scheme of Pendidikan Magister menuju Doktor untuk Sarjana Unggul (PMDSU) (006/E5/PG.02.00/PL.PMDSU/2024).
Conflict of Interest
The author declares that there is no conflict of interest with stakeholders related to the material written in this manuscript.
REFERENCES
Badan Standarisasi Nasional. (2015). SNI. 7352.1-2015. Badan Standarisasi Nasional Bibit Kambing-Bagian 1: Peranakan Etawah. Jakarta.
Baharuddin B, Fitriyah AT, Alamsyah AC, Sheyoputri S (2023). Goat Livestock Business Potential Viewed from Population and Production in Indonesia. J. Adv. Zool., 44(04): 204-107. https://doi.org/10.17762/jaz.v44i4.1735
BPS-Statistics Indonesia (2023). Statistical yearbook of Indonesia 2023.
Boujenane I, Derqaoui L, Nouamane G (2016). Morphological differentiation between two Moroccan goat breeds. J. Livestock Sci. Technol., 4(2): 31-38.
Cankaya S and Kayaalp GT (2007). Estimation of relationship between live weights and some body measurements in German farm x hair crossbred by canonical correlation analysis. Hayvansal Uretim, 48(2).
Dakhlan A, Hamdani MDI, Putri DR, Sulastri S, Qisthon A (2021). Prediction of body weight based on body measurements in female Saburai goat. Biodiversitas J. Biol. Divers., 22(3). https://doi.org/10.13057/biodiv/d220341
Dige MS, Rout PK, Singh MK, Dass G, Kaushik R, Gowane GR (2021). Estimation of co (variance) components and genetic parameters for growth and feed efficiency traits in Jamunapari goat. Small Ruminant Res., 196: 106317. https://doi.org/10.1016/j.smallrumres.2021.106317
Direktorat Pembibitan dan Produksi Ternak. (2020). Clumps/Strain Livestock. Directorate of Breeding and Livestock Production. Ministry of Agriculture of the Republic of Indonesia. Jakarta.
Food and Agriculture Organization (FAO) (2012). Phenotypic Characterization of Animal Genetic Resources FAO Animal Production and Health Guidelines No. 11 FAO: Roma, Italy.
Food and Agriculture Organization (FAO) (2023). Food and agriculture data. https://www.fao.org/faostat/en/#home. [6 Agustus 2024]
Gunderson BK, Muirhead RJ (1997). On estimating the dimensionality in canonical correlation analysis. Journal of Multivariate Analysis, 62(1):121-136. https://doi.org/10.1006/jmva.1997.1677
Guntoro B, Setiawan A, Haryadi FT (2023). Development of kaligesing etawah crossbreed goat in Purworejo Central Java Province. In IOP Conference Series: Earth Environ. Sci., 1183(1): 012104. https://doi.org/10.1088/1755-1315/1183/1/012104
Hotelling H (1936). Relations between two sets of variates, Biometrika, 28: 321–377. https://doi.org/10.1093/biomet/28.3-4.321
Ilham F, Ciptadi G, Susilorini TE, Putra WPB, Suyadi S (2023). Morphology and morphometric diversity of three local goats in Gorontalo, Indonesia. Biodiversitas J. Biol. Divers., 24(3) https://doi.org/10.13057/biodiv/d240305.
Lopes FB, Borjas AR, da Silva MC, Facó O, Lôbo RN, Fiorvanti MCS, McManus C (2012). Breeding goals and selection criteria for intensive and semi-intensive dairy goats system in Brazil. Small Rumin Res., 106 (2-3): 110-117. https://doi.org/10.1016/j.smallrumres.2012.03.011
Manzi M, Rutagwenda T, Kanuya N, Chatikobo P (2019). Phenotypic characterization of goats raised under traditional husbandry systems in Bugesera and Nyagatare districts of Rwanda. J. Anim. Vet. Adv., 10(24): 3297-3302.
Mekuriaw G, Gizaw S, Dessie T, Mwai O, Djikeng A, Tesfaye K (2016). A review on current knowledge of genetic diversity of domestic goats (Capra hircus) identified by microsatellite loci: how those efforts are strong to support the breeding programs. J. Life Sci. Biomed., 6(2): 22-32.
Monau P, Raphaka K, Zvinorova-Chimboza P, Gondwe T (2020). Sustainable utilization of indigenous goats in Southern Africa. Diversity, 12(1), 20. https://doi.org/10.3390/d12010020
Mudawamah Ciptadi G, Retnaningtyas ID (2021). The prolific variation, body morphometrics, and breeding value of Indonesian local Etawah goats based in East Java. Anim. Prod., 23(1): 54-61. https://doi.org/10.20884/1.jap.2021.23.1.85
Ofori SA, Hagan JK, Kyei F (2021). Morphometric characterization and differentiation of West African Dwarf goat populations in Ghana. Trop. Anim. Health Prod., 53: 1-14. https://doi.org/10.1007/s11250-020-02498-x
Pan S, Biswas CK, Majumdar D, Sengupta D, Patra A, Ghosh S, Haldar A (2015). Influence of age, body weight, parity and morphometric traits on litter size in prolific Black Bengal goats. J. Appl. Anim. Res., 43(1): 104-111. https://doi.org/10.1080/09712119.2014.928623
Sahin M, Cankaya S, Ceyhan A (2001). Canonical correlation analysis for estimation of relationship between some traits measured at weaning time and six-month age in merino lambs. Bulgarian J. Anim. Sci., 17(5): 680-686.
Suyadi S, Wahjuningsih S, Septian WA, Furqon A, Putri RF, Nugraha CD (2021). Reproductive performance and fertility index of Etawahcrossbred goats based on several parities at goats breeding stationSingosari, Malang, Indonesia. IOP Conf Ser Earth Environ. Sci., 788: 012136. https://doi.org/10.1088/1755-1315/788/1/012136
Sodiq A, dan Abidin Z (2008). Meningkatkan Produksi Susu Kambing Peranakan Etawa. Agromedia Pustaka.
Sodiq A (2012). Non genetic factors affecting pre-weaning weight and growth rate of ettawah grade goats. Media Peternakan, 35(1):21-21. https://doi.org/10.5398/medpet.2012.35.1.21
Sodiq A, Yuwono P, Sumarmono J, Wakhidati YN, Rayhan MB (2019). Body measurements and testicular characteristics of male Kejobong goats in different coat colors. IOP Conference Series: Earth Environ. Sci., 372(1): 012007.
Tahtali Y, Çankaya S, Ulutas Z (2012). Canonical correlation analysis for estimation of relationships between some traits measured at birth and weaning time in Karayaka lambs. Kafkas Üniv. Vet. Fakültesi Dergisi, 18(5). https://doi.org/10.9775/kvfd.2012.6578
Talukder MAI, Choudhury MP (2018). Phenotypic characterization of Boer and Jamunapari goat under farming condition in Bangladesh. Asian-Australas. J. Biosci. Biotechnol., 3(1): 28-32. https://doi.org/10.3329/aajbb.v3i1.64748
Tiesnamurti B, Sinulingga SE, Gatenby RM (2020). Small ruminant community breeding program in Indonesia. Wartazoa, 30:163-175. https://doi.org/10.14334/wartazoa.v30i3.1935
Tuzhilina E, Tozzi L, Hastie T (2023). Canonical correlation analysis in high dimensions with structured regularization. Stat. Modell., 23(3): 203-227. https://doi.org/10.1177/1471082X211041033
Warmadewi DAI, Gusti, Nyoman Gde, Bidura I, Gusti MN, Budiana, Nimsi, Melati (2023). The coefficient of variation and performance of the production characteristics of the Etawah crossbreed (PE) goat in jembrana regency, bali province. Majalah Ilmiah Peternakan,
Yakubu A, Eyduran E, Celik S, Ishaya JO (2022). Use of linear modeling, multivariate adaptive regression splines and decision trees in body weight prediction in goats. Genetika, 54(3):1429-1445. https://doi.org/10.2298/GENSR2203429Y
To share on other social networks, click on any share button. What are these?

