
Real Time Estimation of Wheat Chlorophyll Content Retrieve from Landsat 8 Imagery Under Rainfed Condition


Real Time Estimation of Wheat Chlorophyll Content Retrieve from Landsat 8 Imagery Under Rainfed Condition
Syed Shah Mohioudin Gillani1, Muhammad Naveed Tahir1, Adeel Anwar1*, Syed Ijaz Ul Haq2, Muhammad Awais3, Mujahid Iqbal4, Javed Iqbal5, Hina Ahmed Malik3, Syed Muhammad Zaigham Abbas Naqvi6, Raza Ullah7 and Muhammad Abdullah Khan1

Figure 1:
Land Cover classification of Chakwal district 2017-18.

Figure 2:
GNDVI map of 2017-18.

Figure 3:
GNDVI graph and ground chlorophyll content.

Figure 4:
NDVI map of 2017-18.

Figure 5:
NDVI graph and ground chlorophyll content.

Figure 6:
CARI map of 2017-18.

Figure 7:
CARI graph and ground chlorophyll content.

Figure 8:
TCARI map of 2017-18.

Figure 9:
TCARI graph and ground chlorophyll content.

Figure 11:
MCARI graph and ground chlorophyll content.
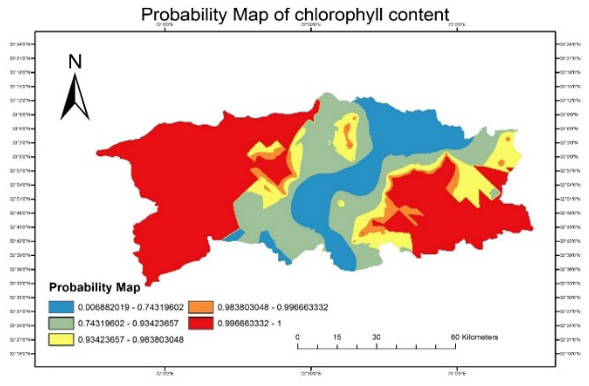
Figure 12:
Probability map of for the prediction wheat chlorophyll content.

Equation 1

Equation 2
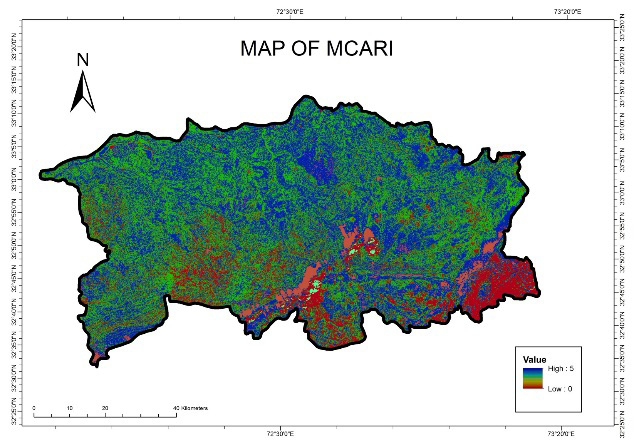
Figure 10:
MCARI map of 2017-18.
March 2023
Vol.39, Iss. 1, Pages 1-297

