Shifted Multiplicative Model Clustering of Environments for Synthetic-Derived Bread Wheat
Shifted Multiplicative Model Clustering of Environments for Synthetic-Derived Bread Wheat
Fida Mohammad, O.S. Abdalla, Sheraz Ahmed, Fakharuddin and S. Rajaram
Map showing the ranking of countries facing severe water stress by 2040
Dendrogram resulting from shifted multiplicative model cluster method on 5 environments. Final groups of environments are marked with arrows
Monthly average distribution of rainfall,evaporation, maximum and minimum temprature 2006-07 at tel Hadya and Breda
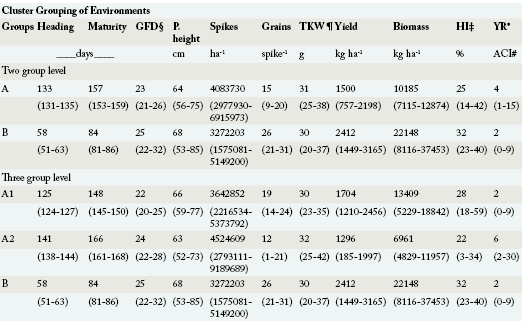
§ GFD = Grain filling days, ¶ TKW = Thousand-kernel weight, ‡ HI = Harvest index, * YR = Yellow rust, A2-2** = Range not given as it contains one element, and # ACI = Average coefficient of infection
*IR: Fully irrigated, § GFD = Grain filling days, ¶ TKW = Thousand-kernel weight, ‡ HI = Harvest index, ** YR = Yellow rust, and # ACI = Average coefficient of infection


