

TCF3/ACSS2 Axis Promotes Proliferation and Colony-Forming Capacity of Esophageal Squamous Cell Carcinoma Cells


TCF3/ACSS2 Axis Promotes Proliferation and Colony-Forming Capacity of Esophageal Squamous Cell Carcinoma Cells
Hongqi Li1 and Meidong Xu1,2*

TCF3 knockdown inhibits ESCC cell proliferation and colony-forming capacity. (A, B) Relative mRNA and protein levels of TCF3 in control (Ctrl) and TCF3 knockdown (shTCF3) ECA109 and KYSE150 cells. (C, E) Number of colonies formed by shTCF3 ECA109 and KYSE150 cells. (D, F) Representative images of the colonies. (G, H) Proliferation curves of shTCF3 ECA109 and KYSE150 cells by MTT assay. Western blots are representatives of at least three independent repeats. Data were exhibited as the mean ± standard error of the mean (SEM) from three independent experiments. **, P < 0.01; ***, P < 0.001.
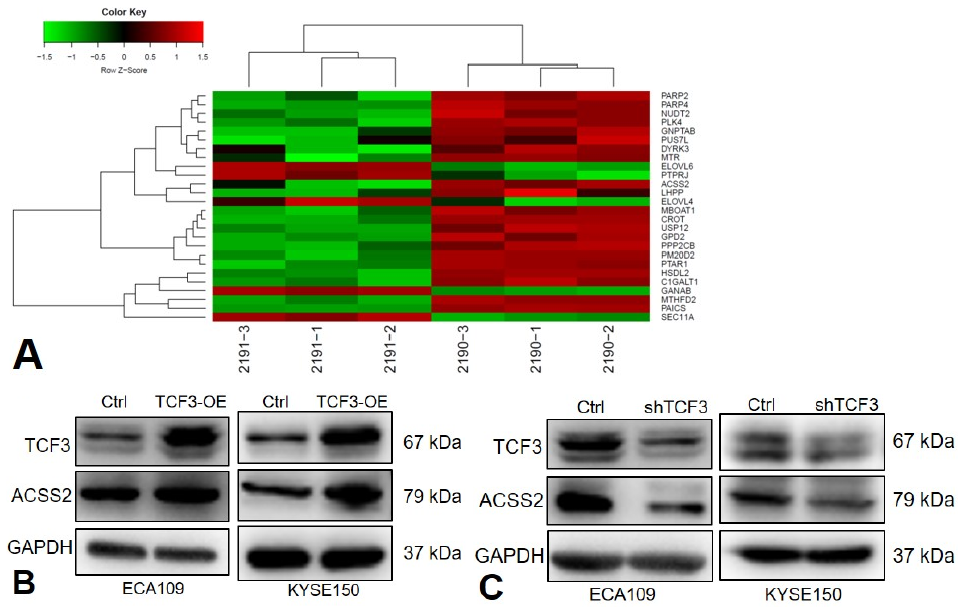

ACSS2 silencing inhibits ESCC cell proliferation and colony-forming capacity. (A, B) The protein and relative mRNA levels of ACSS2 in control (Ctrl) and ACSS2 knockdown (shACSS2) ECA109 and KYSE150 cells. (C, D) Numbers of colonies formed by shACSS2 ECA109 and KYSE150 cells with representative images of the colonies shown on the right. (E, F) Proliferation curves of shACSS2 ECA109 and KYSE150 cells by MTT assay. Western blots are representative of at least three independent experiments. Data were exhibited as mean ± SEM from three independent experiments. **, P < 0.01; ***, P < 0.001.

ACSS2 overexpression promotes ESCC cell proliferation and colony-forming capacity. (A) Protein levels of ACSS2 in control (Ctrl) and ACSS2-overexpressing (ACSS2-OE) ECA109 and KYSE150 cells. (B, D) Numbers of colonies formed by ACSS2-OE ECA109 and KYSE150 cells with representative images of the colonies shown in C and E. (F, G) Proliferation curves of ACSS2-OE ECA109 and KYSE150 cells. Western blots are representative of at least three repeats. Data were exhibited as mean ± SEM of three independent experiments. ***, P < 0.001.
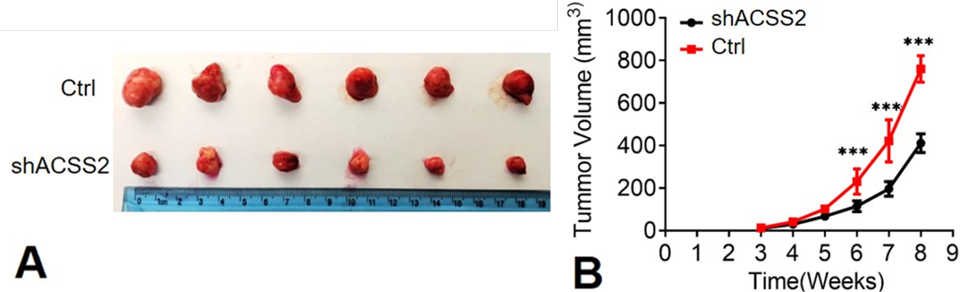
In vivo tumor growth formed by ACSS2 knockdown ECA109 cells. (A) Representative subcutaneous tumors formed by control (Ctrl) and ACSS2 knockdown (shACSS2) ECA109 cells in nude mice (N = 5). (B) Tumor growth curves of subcutaneous tumors formed by control (Ctrl) and shACSS2 ECA109 cells in nude mice. ***, P < 0.001.

