

The Ability to Deal with Metabolic Stress Correlates with Cell Proliferation Rates under 2D or 3D Cell Culture System


The Ability to Deal with Metabolic Stress Correlates with Cell Proliferation Rates under 2D or 3D Cell Culture System
Rimsha Munir1, 2*
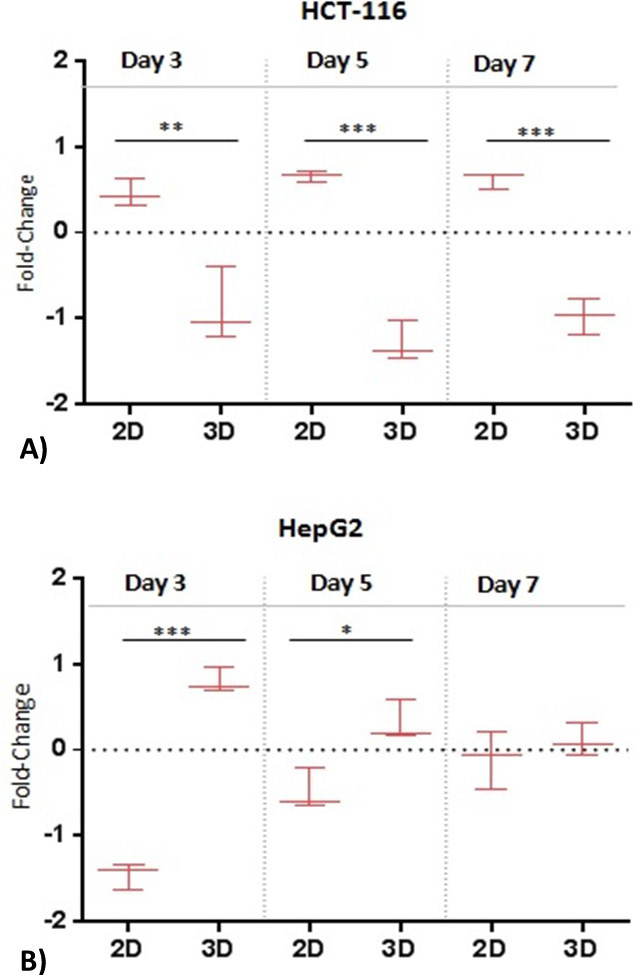
Comparison of proliferation rates in 2D and 3D cell culture systems. (A) HCT-116 and (B) HepG2 cells were cultivated (seeding density; 3x10⁴ cells) in 2D and 3D cell culture systems for 3, 5 or 7 days. At each time point DNA/protein quantification assays were performed to determine cell number. Data were median normalized and LOG2 transformed. Data are representative of three independent experiments. Significance was determined by unpaired t-test. *Significantly different (*p ≤ 0,05; **p ≤ 0,01; ***p≤ 0,001), n.s not significant (p > 0,05).

Impact of metabolic stress on cell proliferation rates in 2D and 3D cell culture systems. (A) HCT-116 and (B) HepG2 cells were cultivated (seeding density; 3x10⁴ cells) in 2D and 3D cell culture systems under normal growth conditions (10% FBS; 20% Oxygen), hypoxia (10% FBS; 0% Oxygen) or low-serum growth conditions (2, 4, or 6% FBS; 20% Oxygen). DNA/protein quantification assays were performed to determine cell number. Data were normalized to normal conditions and LOG2 transformed. Data are representative of three independent experiments. Representative microscopy images of (C) HCT-116 and (D) HepG2 spheroids generated in aforementioned culture conditions. The panels on the right compare diameters of the corresponding cell line spheroids. Data were normalized with median of the normal condition.
(Abbreviations: Nor, normal growth conditions; Hyp, hypoxia; LS, low-serum growth conditions).


