The Influence of Intravenous Lipopolysaccharide Injection on TLR4 Transcription Levels in Duck (Anas domestica) Liver, Spleen and Bursa of Fabricius
The Influence of Intravenous Lipopolysaccharide Injection on TLR4 Transcription Levels in Duck (Anas domestica) Liver, Spleen and Bursa of Fabricius
Jun-Ying Liu, He-He Liu*, Jie Kou, Yang-Mei Zhao, Ji-Wen Wang, Liang Li and Xiao-Hui Du
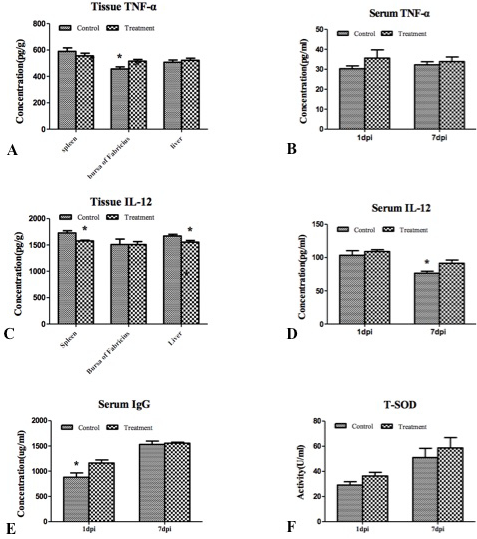
Changes in TNF-α, IL-12, and IgG concentrations and T-SOD activity. A, the tissue concentrations of TNF-α in control and treatment groups; B, the serum TNF-α levels in control and treatment groups; C, the tissue concentrations of IL-12 in control and treatment; D, the serum IL-12 concentration in control and treatment; E, the serum concentrations of IgG in control and treatment groups; F, the T-SOD activity of serums in control and treatment groups. The label “*” on each item indicates a significant difference between the different groups (P<0.05), n=6. “dpi” represents the days post injection of LPS.
Changes in TLR4 and IgM mRNA expression in tissues. Panel A & B show the relative expression of TLR4 and IgM, respectively, in liver, spleen and bursa of Fabricius between control and treatment groups. The label “*” on each item indicates a significant difference between the different groups (P<0.05), n=4


